Analysis of Water Samples Collected From Different Location of Coventry Laboratory Report
Abstract
Around one billion people across the world do not have access to safe and adequate supply of water. Surface and groundwater sources are widely exploited for the vital resource. The aim of this empirical investigation is to analyse different water quality characteristics from samples collected in Coventry. Water samples were exposed to different experimental conditions to examine different parameters. It was found that water from Coventry University College was the safest among the samples wile that from Waterman Road Bridge was harmful. If you are seeking environmental studies dissertation help, our experts can provide the best guidance in place to help you navigate through your research effectively.
Introduction
Byers et al. (2014) report that the society particularly in the developed in positively responding to calls for environmental conservation which is the precursor to environmental sustainability. According to Mackay et al. (2015), the biggest concern for water-based resources is the sustainability of the prevailing and future clean water resource allocation. In the first place, water plays a critical role in sustenance of all forms of life and there is a need to establish a balance between what is needed by the environment and what is needed by human beings (Bureau of Reclamation 2012).

Water is a vital resource in maintaining the balance of nature. As such, changes in particular properties of the commodity, such as purity, have negative impacts in ecological systems. Such changes are usually corrected by certain “negative feedbacks” that reverse the changes and thereby establish the original balance (Critchlow, et al. 1995). In the current spate of urbanisation, population explosion, mechanised agriculture and urbanisation, water resources are increasingly threatened with exhaustion and pollution.
Global Food Security (2013) defines water pollution as a form of environmental degradation resulting from introduction of contaminants into water resources with sufficient treatment to eliminate harmful compounds. Often, the results are usually devastating not only to individual species but also to biospheres. Groundwater and surface water are polluted mainly through point and non-point sources (Absalona, et al. 2014). In the former, contaminants are introduced in water through distinguishable sources such as pipes. For example, storm drains, sewerage pipes and factory effluent drains. In non-point source pollution, diffuse pollutants accumulate in an area after which they are washed off into water systems (Bartram & Ballance 1996). For example, leaching of chemicals and urban runoffs. A good example in Europe is the Black Sea where human pressure has gradually damaged a complex ecosystem. As such, agricultural pollution from surrounding farmlands has led to extensive algal blooms leading to oxygen depletion and subsequent collapse of seabed habitats.
According to Royal Geographic Society (2013), the UK government’s regulatory standards on the quality of drinking water are increasingly stringent. According to Drinking Water Inspectorate (2010), drinking water must be “wholesome” as per the dictates of the law regarding permissible quantities for a wide range of water properties. For example, microorganisms, metals, chemicals, look and taste of water. In the UK, the permitted concentration of E. coli and Coliform bacteria in water is 0/100 ml. For free metals and chemical compounds, the permissible amounts are tiny and are expressed in parts per billion. For instance, the fluoride ion is permitted up to 1.5 parts per million while acrylamide’s is 0.1 parts per billion (Drinking Water Inspectorate 2010).
Dig deeper into Environmental Sustainability Assessment and Impact Analysis with our selection of articles.
Drawing from Environmental Agency (EA) standard scale, only 29 percent of groundwater assessment is considered “good”. However, in Scotland, about 64 percent of surface water resources and 76 percent of groundwater resources are classified as “good” (Royal Geographical Society 2013). According to the Department for Environment, Food and Rural Affairs (Defra) (2013), about 80 percent of English rivers exhibited good chemical quality in 2009 as compared to 79 percent in 2008. Over the preceding five years, gradual quality improvement was noted. In Wales, about 95 percent of total river length had good chemical quality in 2009. The performance had been observed since 2005. Scotland’s Rivers chemical quality was also maintained at 87 percent while Northern Ireland’s rivers had the lowest quality at 75 percent.
Water analysis is indispensable in establishing and maintaining healthy and vibrant societies. For starters, regular testing is important in determining specific prevailing water quality issues (Boye, et al. 2014). Next, it assists in ensuring safety of drinking water. Lastly, water analysis helps in determining the effectiveness of the water treatment system under use.
Boye et al. (2014) note that water analysis should be conducted in ISO-certified laboratories. If unavailable, uncertified laboratories should be accredited by certified labs. Absalona et al. (2014) analysed discharged waste water in several European cities using ISO standards by conducting physical tests, chemical tests and bacteriological tests. A replica of the test was conducted by Lees (1985). In physical tests, the researchers analysed colour, odour, taste and turbidity of effluent water. Chemical tests involved analysis of hardness, pH, chemical groups, biocides and biochemical oxygen demand (BOD). Bacteriological analysis involved testing water for microbial contamination from bacteria present in sewerage effluents. The tests above reflect the physicochemical properties analysed in this report.
The main objective in this empirical analysis was to determine different quality properties of samples collected from sites in Coventry locale. They include River Sowe, Waterman Road Bridge (Coventry Canal), Coventry Canal Basin (City Centre) and Coventry University and Coventry University College. At the University, harvested rainwater parameters were analysed while at the University College, portable drinking water parameters were examined. In the other three sites, surface water was used.
Continue your journey with our comprehensive guide to The Role of Environmental Impact Assessment in Achieving Greenhouse Gas Emission Targets.
Materials and Method
Tested parameters included pH, suspended solids, water hardness, alkalinity and chemical oxygen demand (COD).
The reagents for pH analysis were distilled water and water samples. In determining suspended solid, the reagent was water samples. In analysis of water hardness, the reagents included water samples, EDTA, ammonia buffer and Eriochrome black-T (EBT). Reagents used in alkalinity analysis were concentrated sulphuric acid and the water samples. In determination of nitrate, the reagents were water samples and nitrate/nitrite compounds.
Each analysis test had a specific procedure. They are summarised below:
In pH analysis, beakers were rinsed with distilled water and labelled for each sample. Digital pH metres with rinsed probes were used to measure pH by dipping the probes into the samples. The readings were recorded. In suspended solid analysis, clean and dry filter papers were weighed and placed in filtering apparatus. Water samples were mixed thoroughly and 50 ml of the amounts were placed in filtering equipment and suctioned with vacuum pumps for up to three minutes. Filter papers and the solids were dried in ovens at 105 °C for one hour and cooled in desiccator to room temperature after which the final dry weight was recorded.
In analysis of total hardness, water samples were mixed with 1 ml ammonia buffer and 3 drops of EBT were added. The solution was titrated against standard EDTA. In permanent hardness analysis 25 ml of water samples were put in beakers and let to boil for 10 minutes to remove temporary hardness. Samples were cooled down and losses due to evaporation were compensated by adding more water. Afterwards, the tests in the above paragraph were executed.
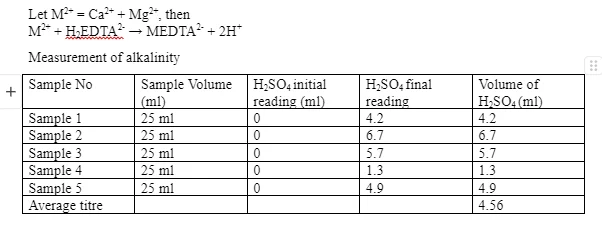
In analysis of alkalinity 100 ml of water samples were put into conical flasks and 3 drops of phenolphthalein were added. The solution was titrated with concentrated sulphuric acid until it turned colourless from pink. Methyl orange indicator was added the solution was further titrated until the indicator changed colour from green/blue to red.
In nitrate determination, nitrate strips were dipped in water samples for a second and removed. Excess liquid was shaken off and after one minute, the colour change was compared to the nitrate/nitrite colour scale.
With regards to health and safety (COSHH), lab coats, gloves and safety glasses were worn to prevent accidental burns from hot samples and oven. Gloves prevented contact with concentrated sulphuric acid while the lab coat covered exposed skin. Safety glasses prevented liquids from spilling into eyes.
Results and Discussion
The following is a summary of the findings
Determination of water pH


Analysis of water hardness
Record of EDTA titrations

Determination of nitrate/nitrite

Discussion

The parameters measured in this empirical investigation are largely physicochemical. The physical parameter was the amount of suspended solid while the chemical properties were alkalinity, pH, nitrite/nitrates and water hardness. Although bacteriological tests were not performed, the five tests are very important in water treatment and can predict whether water is safe for drinking. In the nitrite/nitrate test, the maximum permissible quantity of nitrate ions in water is 50 mg/l while the allowable nitrite proportion is 0.5 mg/l (Drinking Water Inspectorate 2010). From table 5, it is evident that water from Coventry Canal Basin, Waterman Road Bridge, CU and CUC has permissible nitrate concentration. On the other hand, water from River Sowe has five times the maximum allowable nitrate concentration. This can be attributed to application of nitrogenous fertilisers in nearby agricultural areas which are later drained by runoff waters. Regarding the nitrite concentration, only CCU water sample has permissible amounts of the ion. All other samples are unsafe for drinking since their concentration of nitrite ions is double what is permitted. Therefore, except for CCU, they were all out of range. According to Defra (2013), drinking water should have a pH of 6.5 – 8.5. For this reason, all samples had their scores in range. Although low pH values are admirable particularly during chlorination, values below 4 harm living organisms. From Table 4, it is apparent that most of the water is acidic. In fact, water from CU has an alkalinity index of 1.3 which is below 4.3 and suggests free mineral acidity in the sample. This can be attributed to the fact that water is directly harvested from rain without any treatment whatsoever. Dissolved CO2 is the main contributor to acidity. Water from Coventry Canal Basin has an alkalinity score of 4.2 which also indicates a considerable margin of free mineral acidity. Table 2 shows the total dissolved solids for the samples. According to the World Health Organisation (WHO), water with 1000 g/ml of dissolved substances is usually acceptable but it varies. Therefore, water from all sources is safe for drinking going by this parameter. In fact, negative changes in weight were recorded at CU and CCU which indicates that the TDS quantities were so low that no residue was obtained using the filter papers. As a result of extended heating, they lost the moisture and other volatile properties which made them lighter. Regarding water hardness, samples were first heated to remove carbonates that interfere with end-point detection. In the complexometric titration water was shown to contain permanent hardness.
Alternative analysis method measuring total dissolved solids is Formazin Nephelometric Unit (FNU) where infrared light is used to measure scattering of light by solids and estimate their amount. As mentioned earlier, a critical additional method that should have been employed in this analysis is bacteriologic analysis to determine presence and types of bacteria that impact on human health.
The most appropriate treatment methods are primary, secondary and complete treatment. Primary treatment entails ozone treatment, chlorination, membrane filtration ultraviolet treatment. Secondary treatment involves sedimentation and filtration. Lastly, complete treatment entails flocculation, sedimentation, coagulation and filtration. Water is disinfected at this stage. Chemical treatment is required when metallic compounds are excess.
The procedures employed in the tests are standard. Potential errors may have arisen from incorrect determination of endpoints during titrations and colour misidentification in nitrite/nitrate strip test. Future tests should incorporate measures to analyse biological elements apart from physicochemical elements. Also, dry filter papers should be dried further in ovens to allow volatile compounds to escape to avoid scenarios where final weight decreases and becomes lower than original weight.
Conclusion
Going by WHO’s guidelines for safe drinking water, the samples tested in the above trials do not strictly meet the guidelines. The test results for nitrites/nitrates, alkalinity, pH, TDS and water hardness indicate that the water from four sites was unsafe for consumption. Water sample from CUC is safe except that the nitrite concentration exceeded the limit. In summary, farming and industrialisation have negatively impacted on water quality in Coventry and the surface water is unsafe for drinking without treatment
Continue your exploration of Analysing the Impact of Environmental Forces with our related content.
References
Absalona, D., Rumana, M., Matysika, M., & Koziołb, K. (2014). Innovative solutions in surface water quality monitoring. APCBEE Procedia 10 26-30.
Bartram, J., & Ballance, R. (1996). Water quality monitoring - A practical guide to the design and implementation of freshwater quality studies and monitoring programmes. Geveva: UNEP/WHO.
Boye, A., Falconer, A., & Akande, K. (2014). Integrated water quality modelling: Application to the Ribble Basin, U.K. Journal of Hydro-environment Research 20 1-13.
Bureau of Reclamation. (2012). Water measurement manual. Boston, USA: Water Resources Research Laboratory
Byers, A., Hall, W., & Amezaga, M. (2014). Electricity generation and cooling water use: UK pathways to 2050. Global Environmental Change, 30 1-15.
Carlson, B. (2005). An introduction to sedimentation theory in wastewater treatment. Boston: McGraw Hill.
Critchlow, D., Graham, O., & Melosi, M. (1995). Environmental politics and policy 1960s-1990s. Journal of Policy History 13-85. Retrieved May 5 2015
Department for Environment, Food and Rural Affairs. (2013). Environmental statistics – key facts. London: Defra.
Drinking Water Inspectorate. (2010). What are the drinking water standards? London: DWI. Global Food Security. (2013). Agriculture’s impacts on water quality. London: The UK Water Partnership.
Graham, D. (2005). Sustainable drainage systems: Regional drainage policies. Environmental Management, 3 132-150.
Lees, M. (1985). Inland water surveying in the United Kingdom: A short history. Hydrological Data, 85, 36-45.
Mackay, M., Yasseri, B., Gunn, S., Waters, E., & Kelly, G. A. (2015). A meta-analysis of water quality and aquatic macrophyte responses in 18 lakes treated with lanthanum modified bentonite (PHOSLOCK®). Water Research 2015, 5-54.
McDonald, J. (2006). Alkalinity and pH relationships. New York: CSTN.
Royal Geographical Society. (2013). Water policy in the UK: The challenges. London: RGS.s
SEPA. (2012). Water pollution arising from land containing chemical contaminants. Glasgow: Scottish Environment Protection Agency.
Straškrábová, V. (2010). Safeguarding life in our waters. Science for Environmental Policy(22) 2-8.
Appendices


- 24/7 Customer Support
- 100% Customer Satisfaction
- No Privacy Violation
- Quick Services
- Subject Experts