Correlation Of Topographic Slope And Vs30 Test On Application
Abstract
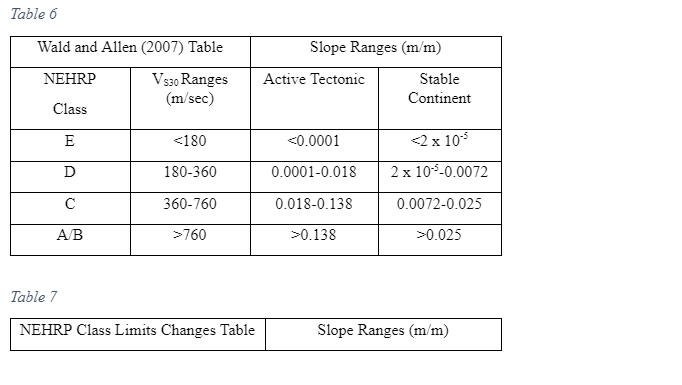
The Vs30 methodology is applied in the NEHRP provisions and in the Uniform Building Code established in 1997 to help in distinguishing different sites into categories when engineering designs that are meant to withstand earth quakes. In recent studies, it has also been proven that VS30 can be integrated into determining the local seismic hazard maps. The existing surface waves, in most cases, have been used to approximate Vs30 for a long period of time. Such methods are non-destructive and sample a broader volume of surfaces in comparison to the borehole measurements. In the past three years, the various researcher has had the chance of testing a simplified procedure to approximate Vs30 and contrast the outcomes to complete the surface wave soundings and the borehole measurements. In such cases, the researchers presented the outcomes of their contrast, practical applications of the same methodology, and the results for engineering practice. However, this paper aims at finding the correlation of Topographic Slope and Vs30 test on application. The study is a qualitative study based on secondary sources. The data that was used to derive this correlation was extracted from various databases, that is 706 sites in Europe and Middle East. The study conducted by Lemoine et al. (2012) majorly informs this particular analyses in terms of establishing the verdict on the efficacy and shortfall of correlating topography and Vs30 in respect to its application. This study used new statistical tests that have been used in active and stable region. The study applied linear regression, confusion matrix, Nash Sutcliffe tests to derive a better od low slopes. Lastly, the study used 21 sites from Reno Nevada in the US. This data helped in producing the map using Arc GIS site class estimated by Vs30 slope correlations. However, the tan conversion method of this sites could not be sufficiently predicted due to the fact the data available is enough to give the right results. The study also borrows a lot from Wald and Allen (2007) in terms of their statistical method in regions that did not have data on seismic region.
. We also suggestvs30 slope correlation proposed by Wald and Allen (2007) by used statistical method in any region those have no details information of seismic region.
Introduction

The shear-wave velocity that is denoted by Vs. is an essential parameter for assessing the dynamic traits of the soil. Vs. is averaged over the top 30m of soil is know as Vs30. The NEHRP principles and the Uniform Building Code use Vs30 to categorise sites with respect to the type of soil for the sake of earthquake engineering systems. The Vs30 method is an interpretation of the Spectral Analysis of Surface Waves (SASW) framework. Furthermore, it also offers a solitary figure for the average shear-wave velocity in the top 30m. The simplified framework on Vs30 is founded on the correlation between Rayleigh-wave phase velocity and Vs30, as shown in Figure 1.

In all the 103 sites collected in the Rayleigh Wave Phase, 33 of those were derived by downhole seismic methodology, while 66 of them were attained through P-S suspension logging and four of them were not clearly demarcated. 50 of the total profiles used are in Southern California, 43 of them are situated in Northern California, while 10 are outside California. For any VS, VP site, the Rayleigh-wave dispersion curve was derived. The study assumed a constant mass density of 1.92 g/cc for every profile. Reasonable differentiation in mass density had an insignificant effect on dispersion. Out of the 103 sites, the data from 15 locations were selected randomly and excluded from the data. The researchers conducted a simple linear regression on the remaining sections. The researchers further conducted a correlation in the wavelength instead of the frequency domain because the wavelength is closely linked to the depth required by the researchers. Therefore, Vs30 has a close correlation with Rayleigh-wave phase velocity at a standard wavelength of 40m (VR40).
Vs30 is seen as the average seismic shear-wave velocity from the ground surface to a depth of about 30 meters. This methodology became prevalent as a framework that characterized local site response with a wide variety of applications that ranged from analysing simplified earthquake designs, systems that could be used in building various condes to the regional and global seismic mapping of hazards. Other correlations that involved local site characteristics such as Vsz revealed that Vs30 is a robust parameter that can be used to characterise local site response for various applications. Wills and Silva (1998) defined Vs30, only as of the shear velocity to a depth of 30m as referred from the travel time (tts30), that required for a shear wave travel from the surface to a depth of 30m or in the opposite direction. This can be written in expression as
The same is equivalent if the shear-wave velocities Vs1 is known for all of the intervening layers of a thickness (d1) that is in-between the surface and the 30 meters depth. The V30 methodology was established by Borcherdt (1992) so give an unambiguous classification of site categories and site coefficients for the sake of estimating site-dependent reaction to be applied in a program referred to as the extensive borehole logging and comparative ground-motion, conducted by the California authorities in 1994.
Besides, the approximation of shear-wave velocity and inferences of Vs30 have been used in different sites, most notably the recent strong ground motions that were recorded in Turkey and Japan. The data collected from these sites provided an extensive new set of data that was useful in the development of strong-ground motion prediction equations (GMPEs) and comparative strong-motion reviews for additional studies. These data also provided the other database to further analyse the efficacy and the robustness of Vs30 as a framework to characterise site reaction to be used in specific sites (Atkinson 2009, p. 995). This study reviews the theoretical and empirical basis for Vs30 as a framework to distinguish site reaction for application in various sections. It gives also gives a closed form of expression that relates to short- and mid-period amplification facets (Humar and Mahgoub 2003). The paper will also review the correlation of Vs30 with other sites characteristics like topographic slope for the sake of mapping geographic variations in ground response.
The framework for 2D and 3D wave proliferation in layered viscoelastic media gives a general hypothetical foundation for site coefficients as proposed in the existing building codes. One of the most straight forward theoretical response is that a homogeneous Type-II S or SH wave occurrence at the base of a viscoelastic soil layer. The remedy to the issue allows the reaction to be disseminated as the functionality of physical limitations of the soil and underlying rock and the constraints of the incident wave (Finn and Wightman 2003, p. 275). The framework, if only assessed for a usually occurrence homogeneous, Type-II S waves gives outcomes that correspond to the 1D response as calculated for an incident SH wave, applying the SHAKE program with physical limitations of damping ratio, shear wave velocity or the shear modulus and density selected to link with the appropriate input ground motion level (Campbell and Bozorgnia 2003, p. 345). Conforming layer reactions, premeditated as a function of the period as normalised by the fundamental period of the site and the ratio of the soil and rock shear-wave velocities for damping ratios of 5% and 20%.
Different traits of near-surface layers normally cause diverse amplification impacts at strong motion sites. Therefore, Vs30 method is majorly recommended as an essential index for demarcating local seismic amplification conditions. Dobry, Borcherdt, Crouse, Idriss, Joyner, Martin, Power, Rinne, and Seed (2000, p. 41) argued that Vs30 is also stressed as a prominent site parameter in Ground Motion Prediction Equation in the Next Generation Attenuation Projects (NGA). Even so, Vs30 fails to include locational response, especially in sites that are set on dense sediments. The parameters of depth such as Z2.5 and Z1.0, which are the depths for the S- wave velocities of 2.5 km/s and 1.0 km/s respectively, were later introduced to account for three-dimensional basin impacts in GMPEs. Dimensions of Vs30 are also available in the various free-field station in the Taiwan Strong Motion Instrumentation Program. Z1.0 was obtained from the stations examined by the microtremor array method in the modern study and will be handy for seismic hazard analysis in various sites. IBC (The International Building Code) allows similar frameworks to be used in the same classifications, with the average velocity being shear wave velocity of the upper 100ft. The sites are classified as;
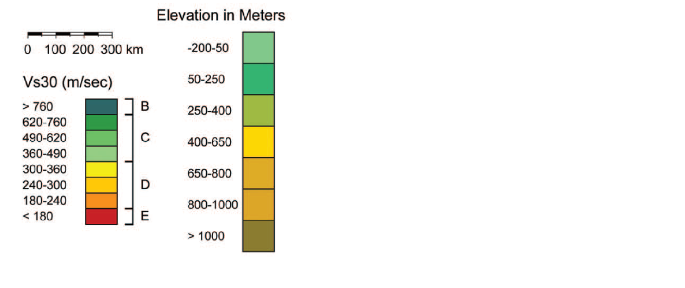
Class A – hard rock – VS30 > 1500 m/s (UBC) or VS100’ > 5,000 f/s (IBC)
Class B – rock – 760 < VS30 ≤ 1500 m/s (UBC) or 2,500 < VS100’ ≤ 5,000 f/s (IBC)
Class C – very dense soil and soft rock – 360 < VS30 ≤ 760 m/s (UBC) or 1,200 < VS100’ ≤ 2,500 f/s (IBC)
Class D – stiff soil – 180 < VS30 ≤ 360 m/s (UBC) or 600 < VS100’ ≤ 1,200 f/s (IBC) Class E – soft soil – VS30 < 180 m/s (UBC) or VS100’ < 600 f/s (IBC)
Class F – soils that need site-specific assessment.
When using the Vs30 methodology, the acquisition of data can be less extensive and faster relative to complete surface wave sounding since only a section of the dispersion curve is relevant when using this model. The interpretation of Vs30 results is always straightforward such that a preliminary interpretation of the data can be determined on site. As stipulated earlier, this methodology is hugely pegged on the correlation between Rayleighwave phase velocity and Vs30, as discussed in the subsequent sections. The same to Vs30, Rayleigh wave phase velocities are dependent on the material properties that are averaged over depth. In both cases, the field technique only comprises of only those phase velocities that are essential for the researcher to obtain an accurate estimate on Vs30 using empirical predictive equations. Boore, Joyner, and Fumal (1997, p. 149) developed a predictive equation using linear regression on various depression curves from Rayleigh-wave and Vs30 coordinates that had been taken from seismic velocity profiles. The chosen profiles have shear and compression wave velocity data that ranged from the surface to a depth of about 80 m or greater values.
One weakness of the Vs30 model has been the scarceness of shear-wave velocity data in various some regions in comparison to various models that were developed for data rich sites have been deployed to approximate site conditions in other regions. Especially the topographic slope framework developed to become the standard way of incorporating site effects into various studies carried both on regional levels and world wide given the opportunities and usefulness of the vs30 model. For instance, Lemoine et al. (2012) assessed the efficacy of topographic slope model for both active and stable regions in Europe using the Vs30 database that was established by the Seismic Hazard Harmonisation in Europe (SHARE) as shown in Appendix C. The outcome of the study gave better estimations than those obtained from purely randomness for active regions, while the same could not be replicated in the case of stable regions. Later in the study, the researchers approved the fact that their examination for stable regions was founded on a limited data-set.
Literature Review
Both theoretical and practical studies support the main significance of the near-surface shear wave velocity (VS) on ground motion amplification. “In the phase of unrestrained and homogenous media VS is directly proportional to the square root of the quotient between the shear modulus and the density of the medium” (Marzocchi, Lombardi, and Casarotti, 2014, p. 964). In all cases, the shear modulus and the density tend to rise with the depth and overall tendency of VS is to reduce the waves that proliferate from depth towards the surface. Such a reduction of VS has significant effects on the conservation of elastic energy (Delavaud, Scherbaum, Kuehn, and Allen 2012, p. 710). For waves that are propagated in a flexible channel, the density and Vs. which is the seismic impedance, and the particle velocity squared determines the energy flux. Due to the energy preservation of energy needs the flux to remain constant, the reduction of impedance ought to be remunerated by the growth in particle velocity, and thus the amplitude of the seismic wave. This impact is, however, partially counteracted by that of anelastic attenuation, which is greater in soft soils. The alteration of ground motions of the landscape conditions, which is normally referred to as side-effects, comprises of local group reaction, basin paraphernalia, and topographic effects (Pilz, parole, Picozzi, Wang, Leyton, Campos, and Zschau 2010, p. 355). The local ground reaction represents the influences of the difference of the physical effects of the near-surface resources on nearly-vertically propagating waves. In local ground reaction, sudden variation changes in medium impedance at depth result in broad augmentation at detailed frequency ranges of ground motion.
Both topographic and basin effects denote the effect of 2-D or 3-D geometric configurations of various seismic waves, and its essence, which can be broader is normally restricted to some locations. Even so, a detailed analysis of side-effects is significant to site-specific studies, and regional examination ought to rely on various simplified methodologies. Goda et al. (2015, p. 8) argued that the application of a quantitative VS-based restriction for a simplified depiction of the site conditions the VS corresponding to the depth linked with one quarter-wavelength at the span of interest. Because of the economic limitation linked with getting data at the needed depth, this framework has been replaced with the use of the time-averaged VS to 30 m depth, given by

In the formula, it stands for the travel time of the seismic wave (S) within every layer up to the depth of 30 m. Stewart et al. (2015, p. 25) argued, according to the past practical studies that advocated for the use of VS30 to categorize locations for building codes and the limitation is used in the National Earthquake Hazard Reduction program and Eurocode. Since VS30 has a strong correlation with deeper velocity structures, it has been demonstrated to describe the side-effects of ground motion occurrences that resemble with the wavelengths that are much longer than 30m (Kurzon, Vernon, Ben-Zion, and Atkinson 2014). VS30 has since developed to become the reference parameter for classifying site conditions in various applications. The methodology is currently used to symbolise place situations in the ground wave, forecast equations, and for modeling ground wave intensification in both seismic hazard maps, and instrumental intensity maps (Medina and Krawinkler 2004). It has long been known that VS30 present several constraints as site conditions parameter. Besides, parameters like the natural frequency of the site, are investigated for enhancing regional site description in various applications.
The initial publication by Allen and Wald (2007) on VS30 correlation with topographic slope used 43 points from Italy, beside the one collected in California, Utah, and Taiwan. The Italian facts are only a minor portion of all the evidence collected from the active areas that that helped in deriving the correlation between slope and site category for active areas, as shown in Table 1.

Wald and Allen (2007) use histograms to compare the restrained and projected VS30 principles for these 43 places and discover a rationally decent correspondence which included Zero prejudice, nonetheless slightly a more standard deviation, 0.19 in comparison to the current Vs., 30 location state maps, 0.16. They noted the under the forecast of VS 30 in the flat-lying Mesozoic water carbonate and evaporite rock of Puglia. Erdik, Şeşetyan, Demircioğlu, Hancılar, and Zülfikar (2011 p. 256) made a comparison of printed site arrangement maps of Istanbul that was a derivative of geological information, and those that were derived by Wald and Allen’s methodology. These authors found that the technique is efficient in NEHRP location class C, but they ought to change the slope bounds for the various categories to get a better match for another location classes though the inference is constructed on a comparison between the restrained and projected VS30 value, but merely on graphic contrasts of classification. Besides, no in-situ dimensions of VS30 were applied, only cases founded on geology, which are a rudimentary estimation to true VS 30 principles (Marzocchi, Lombardi, and Casarotti 2014, p. 961). The French Public Service also undertook a project that verified the applicability of the slope Vs., 30 procedure for various places in France. They concluded that as much as the process works rationally for some sites, for example, the Rhine valley, the Vs. 30, and its equivalent extensions projections for most zones did not match those that were obtained from the same sites in microzononation analyses. The researchers also verified DEMs and Digital Terrain Models (DTMs) of several balances and foundations and resolved that some frameworks gave rational outcomes in some sites but not for others (Marzocchi, Lombardi, and Casarotti 2014, p. 963). Therefore, no DEM or DTM has given the finest outcomes for a specific site. The analysts resolved that slope VS30 methodology when used on a large scale can give “first-order” info where there is no any other dataset.
The development of VS30 Site Settings Map
Approximating geographically-continuous variables from discrete datasets needs the researcher to either to correlate with spatially extensive datasets or the usage of extrapolation or interpolation frameworks. Earth geology-derived grouping schemes have been used to produce regional VS site condition maps that are based on the types of rocks or the geological age. The relations between Vs30 and geologic unit relies on the fact that VS depends on the physical characteristics of the materials like density, cementation, the spacing between fractures and porosity. Kaklamanos, Baise, and Boore (2011, p. 1225) related VS30 data with various geologic units in California and extrapolated based on surface geology to acquire a nationwide VS30 map. The same methodology has since been redefined by using depositional environment and geographic principles as supplementary limitations. Same methodologies have also been applied by Martin and Szeliga (2010, p. 567) in the USA in the state of Utah, who established a geologically-based map of the region in Southern California. The same approach tends to differentiate itself from the one developed by Baker and Cornell (2006) that had an objective of achieving the simplest framework supported by the dataset. For the researchers to achieve their objectives, they utilized various statistical tests such as the t-test to justify the subdivision of the primary set of geological units. The most commonly applied VS30 extrapolation methodology is mostly grounded on the topographic slope. Wald and Allen (2007) developed the framework, which hugely depends on the connection of VS30 dimensions and the topographic slope for regions with active tectonics and those with stable ones. As much as there is no clear physical relationship that connects VS30 and the slope of a topography, one can project that the letter might relate to various geomorphologic environments and lithology in a broader sense, because more competent high-velocity materials and lithology in a wider perspective, since more capable velocity materials, can uphold a steep-slope while fine basin residues would be deposited in flat basins. One advantage of the framework developed by Wald and Allen (2007) is that since topographical data can be obtained globally, then a VS30 model can be derived for any part of the globe. One limitation, however, is that the model is not effective in flat-lying rock zones as compared to other parts. In cases, where dense VS datasets are accessible, the values are spatially correlated geostatistical interpolation framework can be used to develop spatially continuous methodologies. Akkar, Sandıkkaya, and Bommer (2014, p. 572) used the same approach to map VS in San Francisco Bay, finding horizontal spatial correlations in the order of 4km.
The researchers presented a model that integrated surface geology maps with topographic data for establishing VS30 maps. Their methodology was founded the identifying trends between surface-geology resultant VS30 residuals and topographic slope. The outcomes of the study revealed that both Quaternary alluvium and Pleistocene sedimentary segments exhibited various trends with the topographic gradient. The researchers used a Kriging with a trend methodology to achieve the final map of California’s VS30. The terrain-focused arrangement is a programmed system that was formulated by Iwahashi and Pike (2007) and majorly depends on the development of a group of geomorphic groups on a gradient, surface texture, and convexity, with the use of an automatic system. The same methodology has been used to feature VS30 in the state of California and has had positive outcomes. Since shear-wave velocity data is not readily available in different regions, frameworks that have been developed for regions with rich data have been employed to estimate the condition of the site elsewhere. To be specific, the topographical slope mechanism has developed to become the standard way of incorporating site effects into regional studies globally given the suitability that is given by the international VS30 server. Shaw et al. (2015, p. 9) later evaluated the efficacy of the topographic slope methodology in stable and active regions in various regions within Europe, by applying the VS30 data that were compiled in relations to the objectives of the project. The results revealed that while the methodology gave appropriate estimates than pure randomness for regions with active tectonics, this case was different from that of regions with stables continental movements. The authors, however, recognised the fact that their examination for the stable continent was majorly based on the limited database.
Methodology
Inferring Vs30 values utilising topographic slopes is done on the assumption that shear-wave velocities increase on steeper topographic slopes in cases where the soil has bigger grain sizes. The study by Allen and Wald (2007), and Wald and Allen (2007) stipulated that shear wave velocities are likely to increase in soils with bigger grain sizes. Based on depositional energy, soils with bigger grain sizes are deposited on steeper topographic slopes, and therefore the soils are likely to have a higher shear-wave value. In contrary soils with smaller grain sizes are assumed to have been deposited on shallower topographic slopes, and such soils have a lower shear wave velocity.
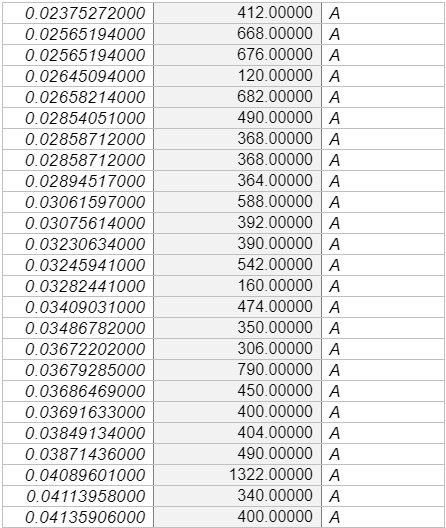
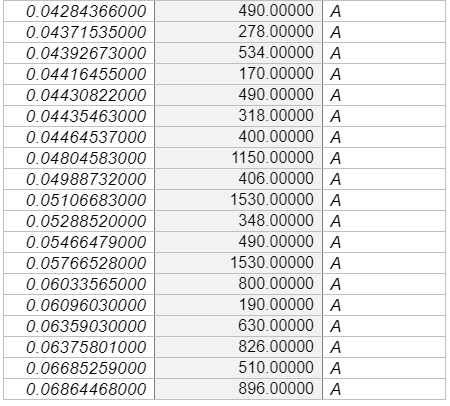
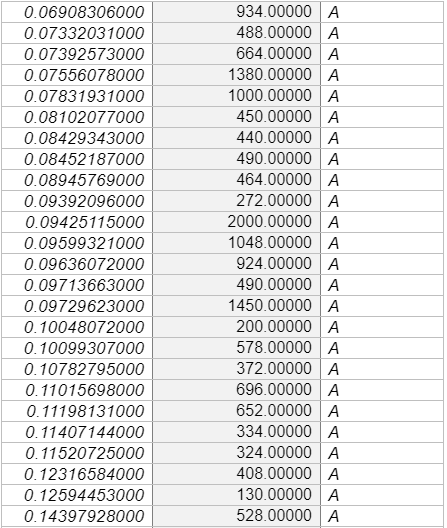
This study will, therefore, incorporate 706 sites measured Vs30 values across various points in Europe, including active sites [574 sites and stable 133 sites], which correlate analysed Vs30 values to topographic slopes that were collected from various studies, most notably by Lemoine, Douglas, and Cotton (2012) as shown in Appendix C. Like Lemoine et al. (2012), this study will use the Greek city of Thessaloniki, as a test case for comparison between the results of the microzonation and site classes that is predicted by the Vs30 slope correlations. These sites were positioned in stable areas, although the conclusion for stable areas is founded on limited data. To compare the data collected by the control site, which in this case is the Greek city of Thessaloniki. The researcher used MINITAB software to conduct a linear regression and confirmed the same values using MS-Excel software. The researcher also used MS-Excel to plot the necessary graphs for this study.
Data Collection
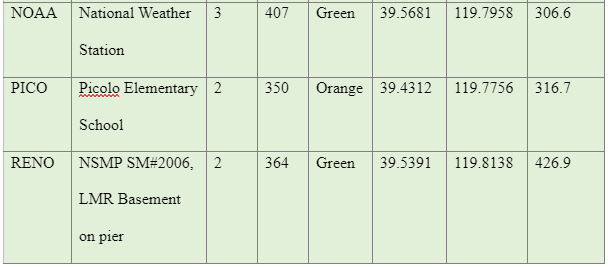
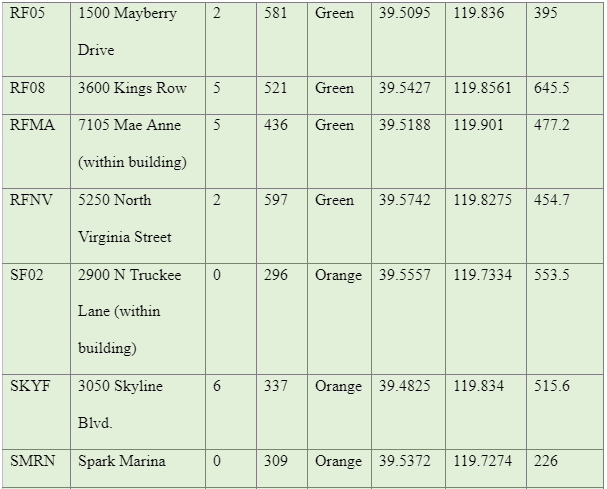
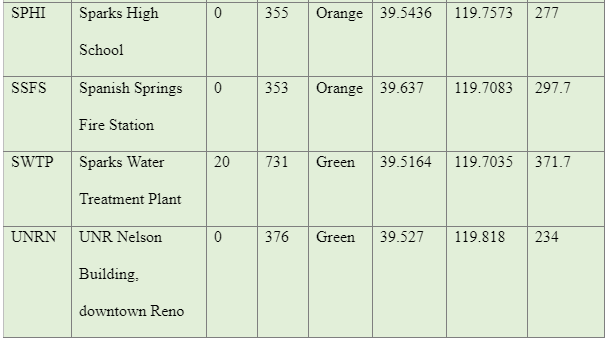
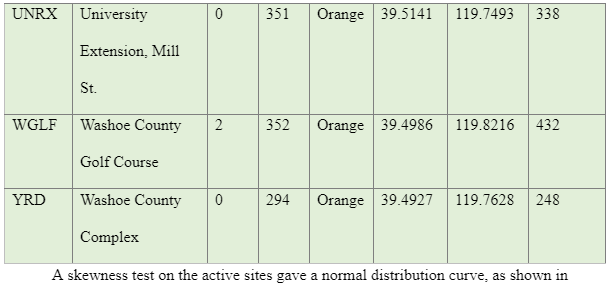
The data used in this study were majorly collected using secondary sources from various publications such as studies conducted by, Lemoine et al. (2012), and Pancha, Anderson, and Louie (2007). The study by Pancha et al. (2007), evaluated the site condition of 21 Advanced National Seismic System (ANSS), strong-motion, motion sites in the Reno-Sparks, Nevada areas as shown in Appendix B. The researchers used the refraction microtremor (ReMi) technique developed by Louie (2001) to measure shallow shear-wave velocities. Using Ms-Excel, a descriptive analysis gave the following results as shown in Table 2

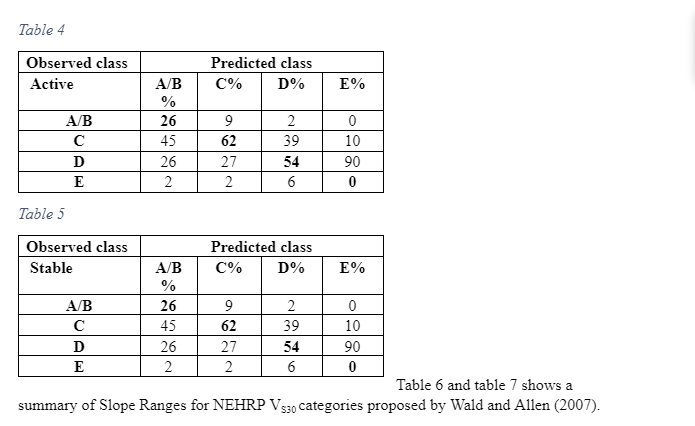
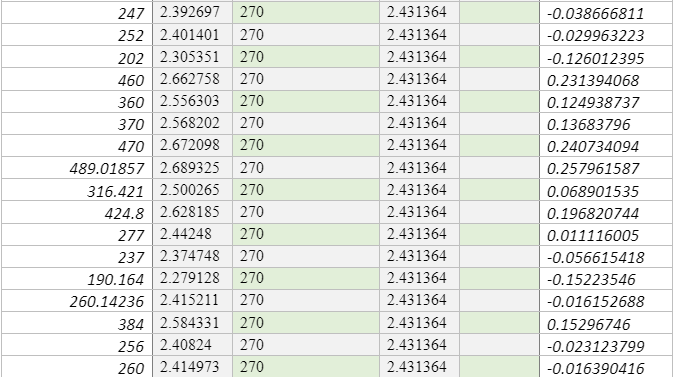
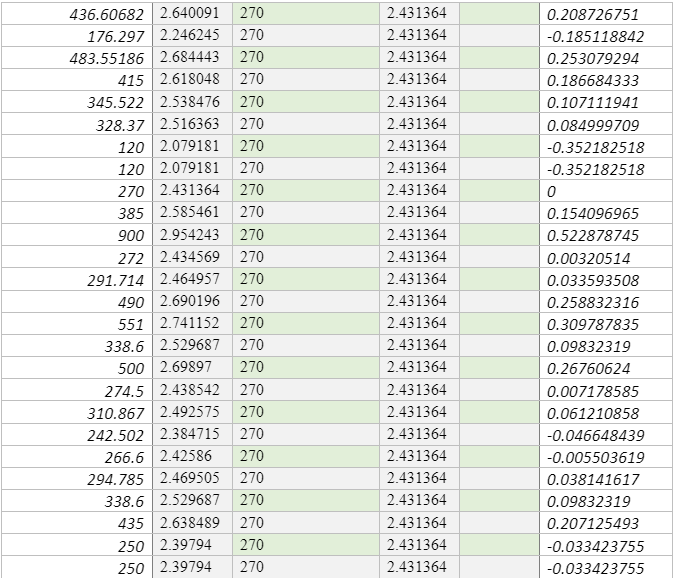
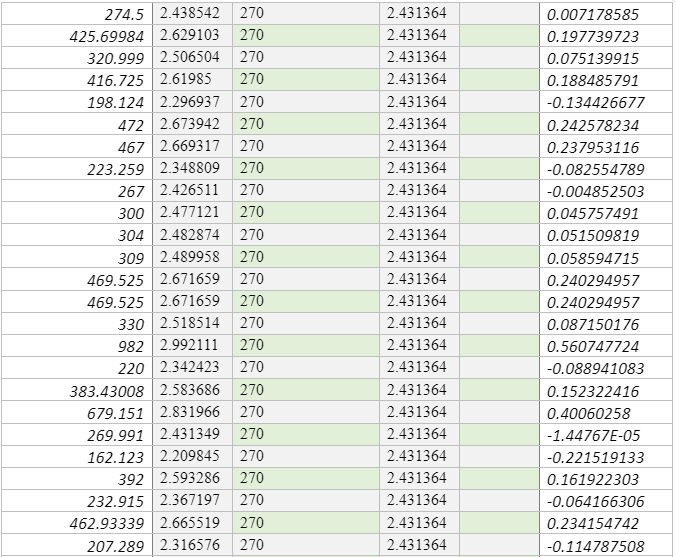
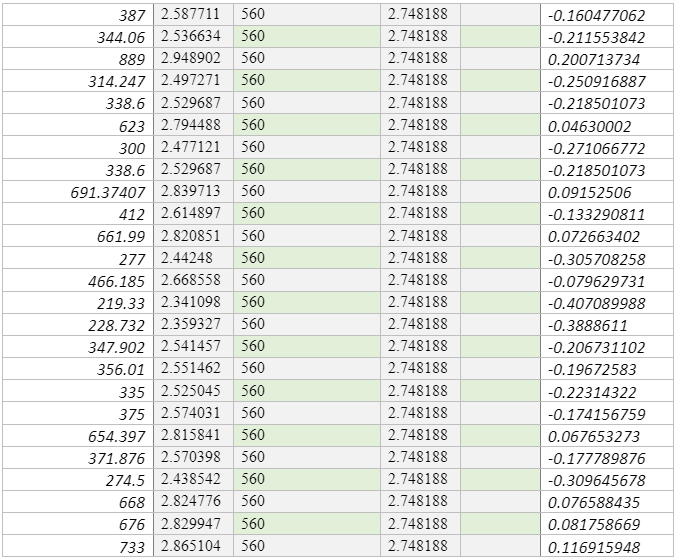
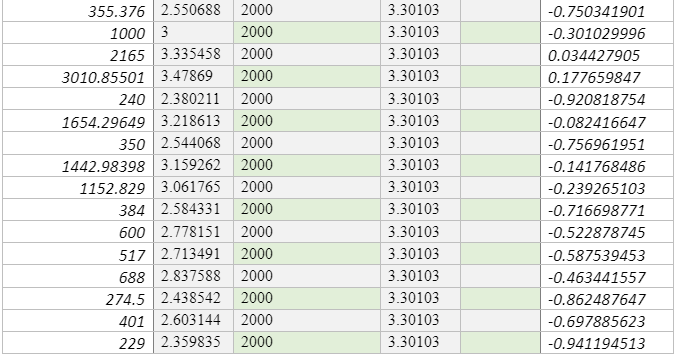
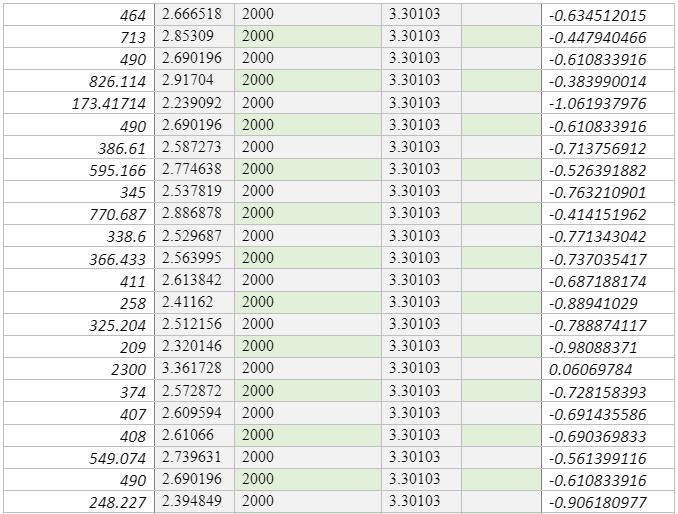
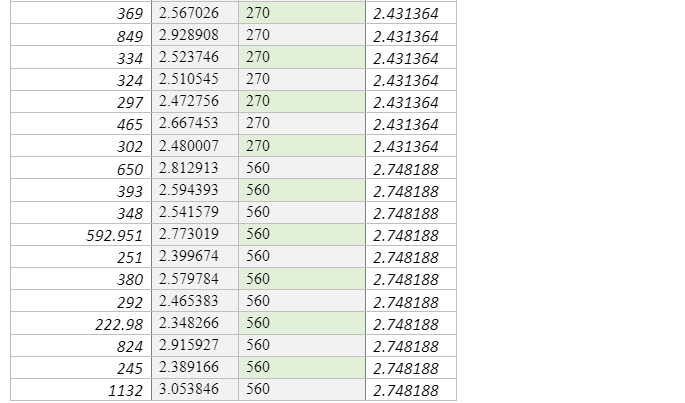
The researcher solved the percentage of sites using the methodology established by Wald and Allen (2007) by statistical method made by Lemoine et al. (2012). The procedure above was predicted horizontally based on the Vs30 as shown in the scatter graph in figure 2 and figure 3, based on the Vs30 in scatter graph inside the colour code box in reference to NEHRP class number of points in every box, and are sub-divided by the total coe that isa based on Vs30 in every box multiplied by 100 in the following classifications A,B, C, D, and E. Table 4 and Table 5 shows the data extracted from the principles advocated for by lemonie et al. (2017) matrix form in statistical methodology. This study classified the procedure of both regions in the matrix form vertically predicted based on the topographical slope in Scatter graph in the colour box with reference to NEHRP class number of points in every box, and divided by the total code based on topographic slope on every box, multiplied by 100 in classification A, B, C, D , and E.
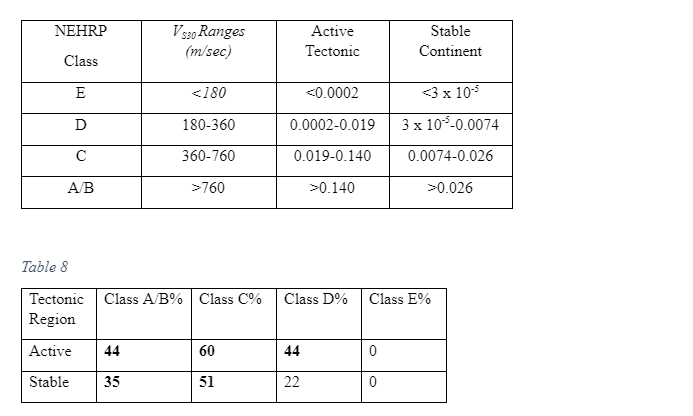
The above highlighted value in table 8, table 9 and table 10 speculatively changes the limits in Wald and Allen (2007) classes which the effect of the value changes compared form Lemonie et al. (2012) tables do not have much variation in attaining the 100% of the heavy slope. The study, therefore, concludes that in low slopes in this method.
Note: if the table limit changes in high value, all value perhaps changed. We cannot observe the value of changes vs. the original value. So slightly improved the value form the Wald and Allen class table (2007).
Table 11-Correlational Data of Reno Nevada


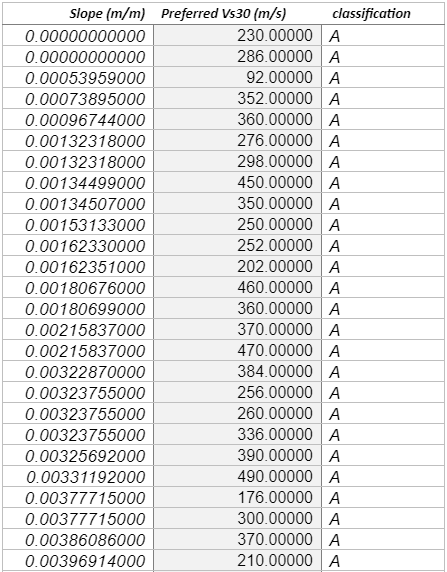
The other set of data was collected from Lemoine et al. (2007). The authors recommended site classifications based on the VS30 slope correlations that was developed by Wald and Allen (2007), which is applicable only to the regional and national studies in various active parts of Europe and only when there is no detailed data, excluding locations inside small basins, those that have special geological condition that could affect the results such as extremely flat-lying volcanic plateaus, coastal sites especially in cases where the slope is not calculated using bathymetric data, continental glaciated terrain, and carbonate rocks. Lemoine et al. (2007) evaluated the applicability of these methodologies using 706 sites that were newly incorporated to the geological database and the appropriated Vs30 values and their topographic slopes for various sites in Europe and part of the Middle East. The new statistical tests were conducted to evaluate the predictive power of the procedure in the region. The researchers estimated the percentage of sites accurately classified or misclassified for every site for active and stable regimes. The Lemoine et al. (2007) also analysed the marginal distribution of the input VS30 and slope values and their effects on the Vs30 slope correlations and assessed whether the framework works better than chance. They also considered the surface of the geological sites and investigated whether variation in geology can help in explaining why the same methodology poorly classifies some locations. Lastly, these researchers used the Greece City of Thessaloniki as a test case for conducting comparisons between the results of a recent micro-zonation and the site classes predicted by Vs30 slope correlations. The results given revealed that the method is more efficient than a chance for all sites in the active regions, but only for class B (rock) and to some extent class C stiff soil site that is located in stable areas, as much as the conclusion made in stable areas were majorly based on limited data. It is in the same study that Lemoine et al. (2007) recommended that Vs30 slope should only be used for regional and national first-order analyses inactive parts of Europe, and only when there is no more detailed information, which excludes sites inside small basins or sites with special geological set up that could affect the overall results as stipulated above. The data collected were classified into two parts which were classified as S and A (S- for Stable sites, and A for active points), as shown in Table 4 and Table 5, respectively.


The Scatter graphs in figure 3 and figure 4 represent a randomly reduced Vs30 values in the 706 sites on both active and stable regions. The study randomly reduced the data collected by Lemoine et al. (2012) in the Middle East countries. In the active regions the site analysed were reduced from 574 sites to 233, while the stable sites were reduced from 133 to 59 sites. The study used this reduced sites to plot the graph in shown in an better visibilities of the sites.


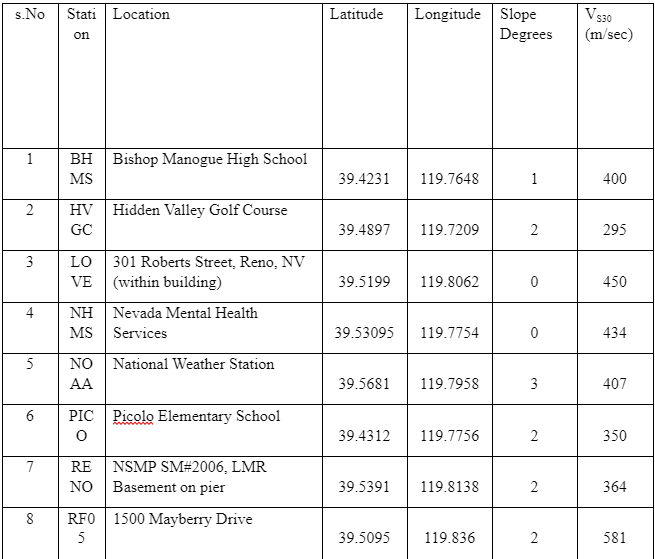


The results from the Nevada site in table 13 reveals that VS30 is much higher than projected in alluvium-filled basins, that is based on NEHRP provisions (The data on Nevada is documented in Appendix A). Mapping geological surfaces are not the only predictive results for analysing Vs30 due to the existence of the Tertiary sediments. The location classifications of Nevada appear to very variable with theperiodic spatial alterations in site class, which are linked with the Basin and Range tectonic province.
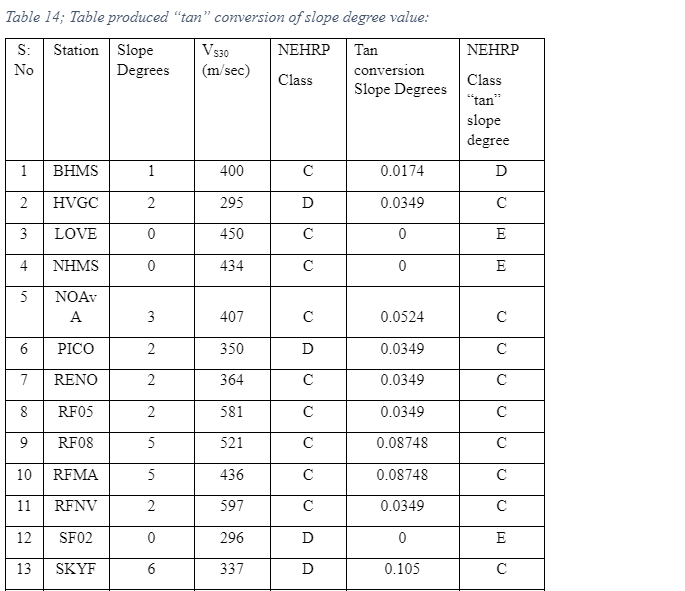

Table 14, produced a conversion of tan slope degree Pancha et al. (2007) and compared tan slope degree value in NEHRP class Wald and Allen (2007)

Noted:
Observed and predicted greater than class 19% of 21 sites changed the class of using tan conversion.
Observed and predicted less than class 52% of 21 sites changed the class of using tan conversion
Observed and Predicted Same class 29% of 21 sites using tan conversion.
Report
Therefore, the study got 19%, 52%, and 29% the condition not satisfied to approach the statistical method in these 21 sites. Data is not sufficient in the active region of Reno, Nevada, US.
Mean & Std. dev of Europe & Middle East countries.
Lemoineet al. (2012) histogram produced the same results in the the same sites with the same data but the value of ranges in slope for prediction. So the lemoine et al. (2012) produced histogram value of mean & std dev. In figure 6 lemoine et al. (2012)
For active region mean (-0.024) & std. dev. (0.221)
For Stable region mean (-0.056 and std. dev. (0.241)
So the values slightly vary form our value because of the prediction of slope value are different. So it would be zero bias in the both region so a better chance.
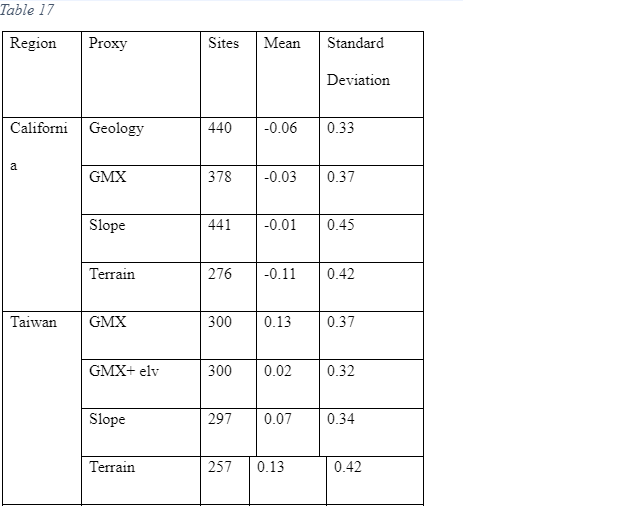
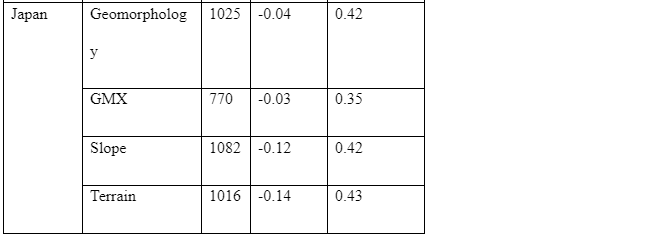
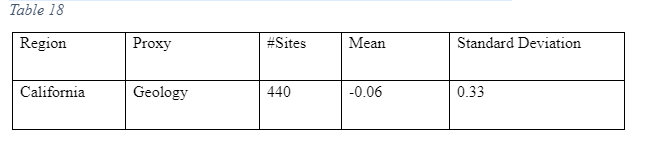
Noted: the result of our values mean & standard deviation and proxy-based estimation of vs30 in the region of California, Taiwan, and japan. The analysis revealed low zero bias
Analysis
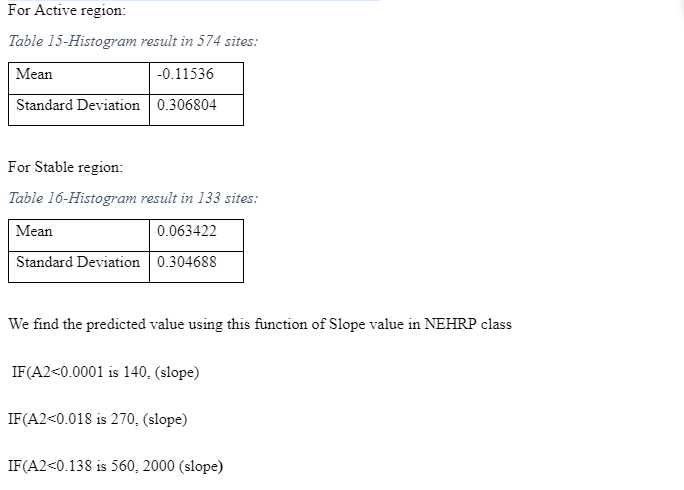
The NGA-west database a reference point and therefore there is a need to analyse this site before proceeding to other sites. In the NGA-west site result: For Active: mean: -0.11536 and standard deviation: 0.306804 For Stable: mean: 0.063422 and standard deviation: 0.304688

Active Regions
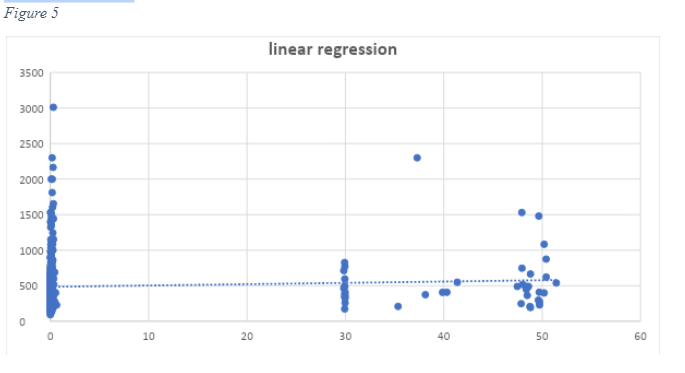
A linear regression model was used to find the necessary correlation between the values coordinate. Figure 3 shows the regression equation in Active regions by statistical method (706 sites).

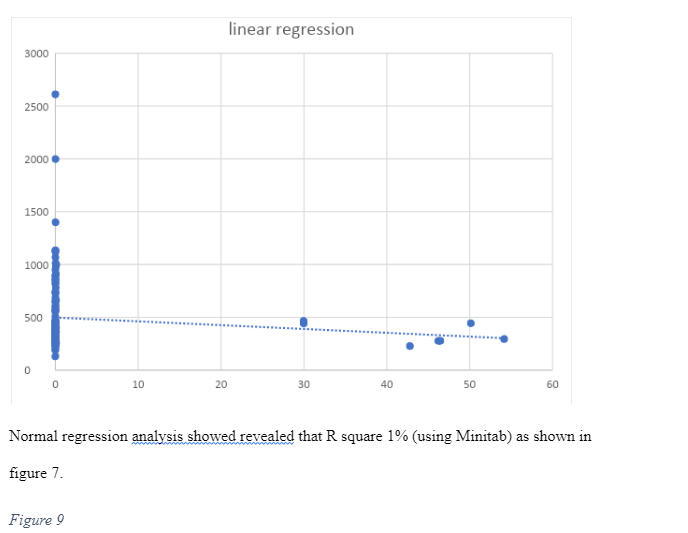

The NGA database was established on the already existing PEER Strong-Motion Database that was created by the Pacific Engineering and Analysis in the 1990s. The main aim of developing this database was to bridge the existing peer data with the current earthquakes, and hugely expand on the supporting data to satisfy the needs of ambitious scope of framework development established by the NGA project. By 2005 the database was complete, and the developers embarked on the errata reports, and limited updates as information like Vs30 (which is the average shear-wave velocity to the 30-meter depth of the stations like in California and Taiwan. Table 8 shows the relative Proxy weights by their respective regions and applied weights for Vs30 estimates for the proxy sites.
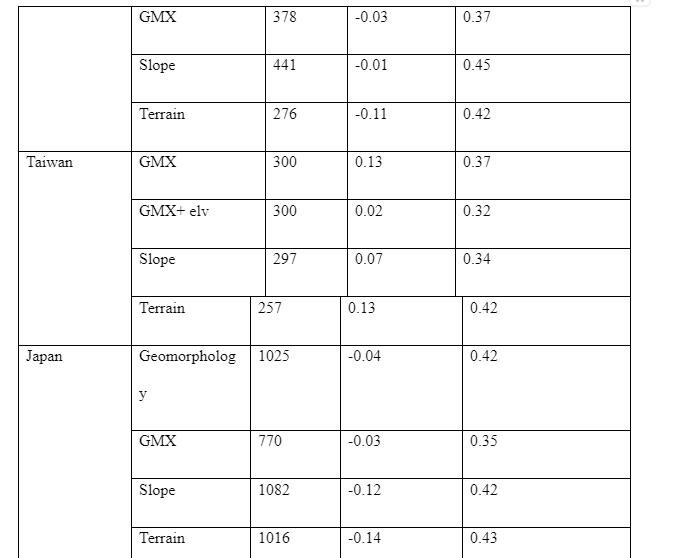
The VS30 values were derived from the Pacific Engineering data set that had more than 1500 Vs. sites. In this case, only places that had Vs. measurement at a depth that is more or equal to 20m was used, with the 20m shear-wave velocity extrapolated to 30m to appropriate Vs30 coordinates. Secondly, Vs30 coordinates were inferred from site geology for California sites that had experienced the Northridge earthquake from the analysis made by Borcherdt (2003) and four other stations from the surface geology. The third site was inferred from non-California sites from regions with Vs30 sites that were established by Pacific Engineering. Another Vs30 measurement was assumed by the Central Weather Bureau, in Taiwan using a specific relation of Vs30 as the functionality of Geomatrix classification and station elevation. In regards to the development of this database, and its accuracy (as much as the uncertainty at these sites us non-zero due to the fact that the measurement may have been made up to 300m), the study will use it a reference point when analyzing other sites. The measurements of the NEHRP D site gave a standard deviation of 0.08, which meant that the data was close to attaining accuracy as compared to other datasets.
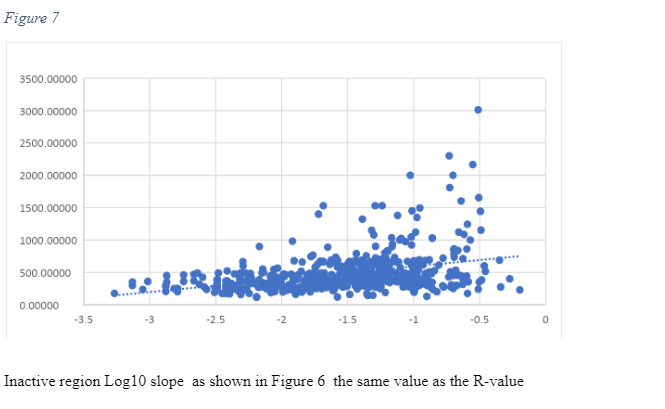
The first step for this research involves correlating Vs30 (m/s) with topographic slope (m/m), at each Vs. 30 measurement point of active sites. Table 2 and table 3 Is a representation of the correlation between Vs30 and the slope for stable sites collected, which uses the measurement from various points in Europe. Generally, the trend figures depict an increasing Vs30 with increasing slope, which implies a faster, more competent materials that hold steeper slopes. There are major scatters that would be used to reveal that the trend is enough so that it can be used to predict Vs30. However, there are some biases in data sampling, especially in the lack of Vs30 measurement at steeper slopes. Most of the Vs30 data collected are present in samples that have a relatively low gradient that is less than 7% or a slope that is approximately 4 degrees. Generally, Vs30 measurement is collected as an effort to characterise amplification at low Vs30 sites, instead of hard rock sites, and as Wills and Clahan (2006) stipulate, data from Vs30 rocks sites are likely to show more scatter. Research should not anticipate for a direct, physical relationship between Vs30 and the respective slope, and in fact, there is no analytic formula that emerges from such data. Instead, the researcher must characterise the relationship in reference to its discrete steps in shear velocity values, that are associated with the respective countries authoritative body. The site boundaries are furthermore subdivided into more narrower velocity windows to help with increasing resolution when probable. The slope ranges for every site was primarily based on the primary regression analysis, but the final assignment of starting and ending slope coordinates needs subjective variations, in cases where the fewer data limited regression analysis. The topographic slope at any site that is within this window was assigned a Vs30 correlation through interpolating over the subdivided NEHRP boundaries that are based on the value of the slope. Lemoine et al. (2007) majorly used this approach. However, it somehow differs from the one that was used by Wald and Allen (2007), who used the median velocity of the subdivided NEHRP classifications for the location that had slope value with the specified range. Unlike Lemoine et al. (2007), it should be noted that this study did not use the Thessaloniki Vs30 to establish the correlations given in this study. From the study of Lemoine et al. (2007), it should be noted that Thessaloniki had systematic low shear velocity as compared to other slopes when compared to the various mean value from different regions. The researcher has also conducted various linear regression analyses on both elevation and slope, which helps to correlate these sites jointly with vs30. Notably, slope and elevation directly correlate; however, elevation does not give a clear prediction of Vs. 30 as compared to the slope. In a real sense, there are various sites of low slope over a wide range of various elevations. Therefore, it can be concluded that the joint analysis seemed to be weaker than in the case of using a slope. In the analysis, the two different data sets were evaluated for Reno, Nevada, and Europe.
Regression Analysis
This study uses regression analysis to examine the relationship between the topographical slope (independent variable) and Vs30 (dependent variable). The regression analysis produces a regression equation where the coefficients represent the relationship between both the independent variable and the dependent variables. These equations will be helpful in making various predictions. The data collected in NGA-database as shown in Appendix A- for both active and stable regions gave the following results. For Active regions the mean and the standard deviation are as shown in table 19.
From the analysis, a standard deviation is relatively low revealing a normal distribution of data. The correlational analysis on the topographic slope and Vs30. The correlation revealed a positive correlation between the topographical slope of active regions with their corresponding Vs30 values. Table 20 depicts the mean and the standard deviation of the stable sites. A regression analysis revealed that a negative correlation between the topographical slope and Vs30 values. Which implies that Vs30 values cannot be effectively used in stable sites
Reno, Nevada
In an attempt to establish comprehension of the distribution of average shear-wave velocities in the Reno region, and how it relates to geology, Pancha, Anderson, and Louie (2007) considered the parameter that could control sediment deposition. The report documented that the laboratory measurements, seismic velocity, is majorly influenced by lithology. The overlap of the velocity range between various lithologies implies that velocity is not the best criterion for determining lithologic determination, apart from general terms. Seismic velocities are normally observed to be greater in volcanic rocks than in deposits of sedimentary surfaces with huge rocks having the biggest velocities.
The study by Pacha et al. (2007) aimed at determining the shear wave velocity profiles at ANSS strong motion stations that could be applied to other sites data from those instruments and to establish and test the correlation between the traits in a site and shear velocities for use at sites that do not have shear-wave velocity data. From the data collected in Reno, Nevada, geology (Table 4) seems to be the best indicator of velocity in the data from various scattered sites. Scott et al. (2005) also established that related united cannot be differentiated, and therefore there is a need for using geological classifications to limit the average velocity values, which are useful in providing first-order predictions of shear-wave velocity. From the analysis of the Reno, Nevada sites, it is clear that sediment content can be used to predict velocity since it has been derived from deeper material or has been deposited by the same geological systems as deeper material, they are deputations for the more profound content. Therefore, more investigations using the ReMi technique are necessary. Besides for a correct site condition, more studies are needed to enhance the correlation of both velocity and velocity residuals with geological predictions and soil characteristics. For more accurate prediction of a site condition, more investigation needed to enhance the correlation of both the velocity and residual velocity with geological predictions and soil properties. Multivariate regression, including geology, more extensive data could justify soil aging and the development of soil. Figure 11, reveals the Reno, Nevada
The observed and the predicted correlations was greater than class 19% of the 21 sites, and changed the class later using the tan conversion. At the same time 52% of the 21 sites altered the class using the tan conversion. The observed and predicted same class 29% of 21 sites when using the tan conversion. Chanced “tan” conversion value of slope degree in NEHRP class percentage 0%, 0% and 100% it should be correct. Therefore, the study got 19%, 52%, and 29% the condition not satisfied to approach the statistical method in these 21 sites. Data is not enough in the active region of Reno, Nevada, US.
European Sites by Lemoine et al. (2012)
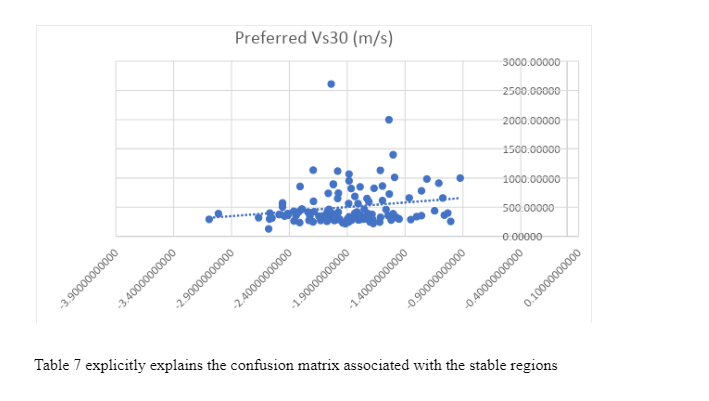
The average topographic slope for the 706 Vs30 (Europe) stations is shown in Figure 2, according to this graph, as the grid decreases the topographic slope value gradually increases, probably because of the larger grid sizes smoothing out the topography. As the grid size reduces, local topographic features, some with steep topography could be led to greater topographic slope value. The predictive correlation that was recommended by Wald and Allen (2007) for the 706 sites have been condensed in table 4 and table 5; it is evident from these tables that the correlation was highly efficient in active regions, but was poor in predicting classes for stable areas. Due to the huge variation in the slope limit between active and stable region for NEHRP class B sites that was endorsed by Wald and Allen (2007), when the constraints for stable zones (as applied in the NGA-West Vs30 measurement) are applied from active zones, most class B sites are classified appropriately. The outcome of this practice is that most sites that were classified as either class C and D by Lemoine et al. (2017) were inappropriately classified as class B. Figure 3 and Figure 4 show a scatter box graph that would help to interpret the distribution of data in the Middle East and the topographical slope correlation with Vs30. The active region scatter line revealed a positive correlation between the topographic slope and the Vs30 value, while the opposite was experienced in the stable region.
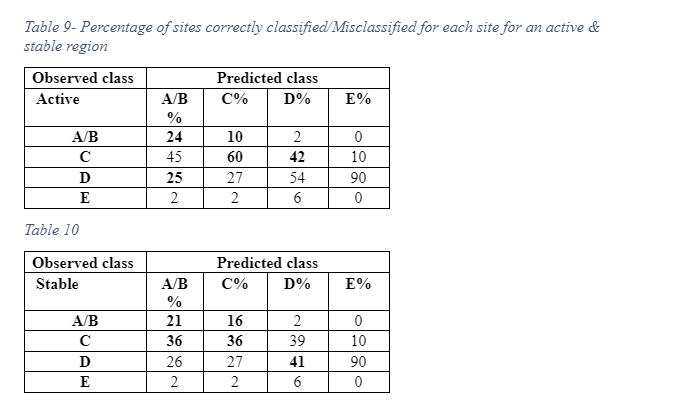
The result of taking an assumption that the constraints of active zones for all locations are the opposite; an improvement in the classification of class C and D sites but a reduction in the ability to predict class B sites. Trying to get the difference between class C, D, or E in regards to their site’s soil, where the location amplification is possible, and class B can help in getting better results. For instance, 85% of sites classified as either C, D or E by Lemoine et al. (2017) are rightly classified in the case of active regions, but 90% of the Vs30 values that were observed, and about 10% of class A and B sites. This denotes that this apparent improvement cannot be real. Table 7 revealed the percentage of sites misclassified for every predicted site class. Such a controversial table is referred to as the confusion matrices.
The subsequent issue about the correlations hold in places of similar overall topographic expression but depict radically different geology, geomorphology, and tectonics. The data collected in Nevada are used to test the above hypothesis, this is mainly because the site classes on a national scale can be analysed and comprehended easily, and play an important life in terms of providing a direct comparison. The abundance of VS observations used in the Nevada observations used in this study’s correlation gives a valuable case for validating this hypothesis by ensuring that the slope calibration with Vs. 30 is robust in the data set collected. The VS 30 Values around Nevada vary widely. However, they do so with systematic trends that are recovered through the topographic slope. Table 4 gives an overview of the ratio of measured versus the Vs30 values derived from the slopes measured. On the presenting Nevada site class map, this study assigned the median shear-wave velocities that are based on the NEHRP categories that were adopted by Wald and Allen (2007) and was also used in the NGA-West database. Just as Wald and Allen (2007), class E sites were not measured using NEHRP methodology; however, the researcher used VS 30 of 150 m/Sec. The topographically derived site class for Nevada provides a better fit to Vs30 observations than the geography-based map. Even so, there could be various biases in the statistical comparison due to the principles of Vs30. Currently, the authorities in Nevada are working on a revised site-classification framework that will improve more comparisons with the current data that was collected. From Figure 2 it can be noted that there are significant numbers of examples that are represented in this study that population exposure tends to directly correlate with Vs30 site condition as examined from the slope of the topography. Naturally, such results are not surprising due to the fact that steep slopes are not normally considered stable enough for the building, while flat, to gently sloping sites have more fertile soils that are efficient for agricultural purposes and have been known to support building structures.
From the data collected of the physical properties of soils, the soil that has a strong effect on shear modulus is likely appropriate to the sheer velocity. Generally, the void space and effective mean stress dominate shear modulus variation due to the fact that the differences tend to be rather lesser in soils. In consideration of the shallow condition that is top 30m, implies that the primary efficacy stresses do not varieties from each other intensely. Therefore, among other physical limits, the void ratio is among the essential affecting of shear modulus. Ghofrani, Atkinson, & Goda (2013) reported that that the soil texture and the grain size distribution could act as an effective metric of measuring the void ratio. For the Nevada area, and the NGA-West sites, the soil is divided into different textual clusters, as per their respective grain sizes distribution and established that shear-velocity is likely to increase as the mean grain size also increases (Seyhan, Stewart, Ancheta, Darragh, & Graves, 2014). Meaning that the sheer velocity improves with the increase in grain size, which is also an explanation of why lower shear velocity and topographic slope have an efficient correlation, especially size decreases as the available energy in the depositional environment decreases at lower slopes. Fumal and Tinsley (1985) reveal that the two most dominant physical properties that determine shear velocity include hardness and fracture spacing. Enhanced hardness and spacing, lead to higher velocities while reducing properties are likely to lead to reduced velocities. Also in this segment, it is expected that these parameters are also correlative with topographic slopes, due to the fact that hard rock and coarse fracture spacing are known to resist weathering, which allows rocks that have higher shear velocities to have a steeper role. In semi-arid alluvial fan system that is found in some sites in Nevada, California, (in the NGA west database) and Europe, mountain fronts generally steep the bedrock slopes to the exterior of the fan, where channels are extremely shallow and braided. In overall, there is a reduction in grain size down fan as the essence of streamflow deposits controls that of debris flow deposition. With an increase in distance from the mountain front, floodplain deposits will remain to decrease in the size of the soil particles as deposited at decreasing slopes by the less powerful fluvial and pluvial process.
Discussion and Conclusion
The correlations of Vs30 with other correlations have revealed that Vs30 is a powerful parameter for predicting site response, especially for active regions. However, some researchers do not agree with such notions based on a study they conducted, for example, Castellaro et al. (2008) challenged the use of Vs30 in a study they conducted on Borehile shear velocity and used a different regression model to infer the connection between the Vs30 and site amplification. Boore, Thompson, & Cadet (2011) wrote that it is a well-known fact that “Orthogonal Regression Model” tends to give a different regression relationship when used to analyse a set of data when compared to the “Ordinary Linear Regression Framework,” with the choice of the relevant model that is determined by either the uncertainty in both the dependent and the independent variable or the uncertainty in the independent variable, that is Vs30 is kind of less than that in the dependent variable, which in this case is the amplification. In cases where the empirical data has been applied in deriving the link between Vs30 and the amplified sites. Boore, Stewart, Seyhan, & Atkinson (2014) argued that the uncertainty levels in the Vs30 measurement range between 1-3%, which is much lesser than the uncertainty recorded in most amplification variables. Therefore, the inaccurate usage of the Orthogonal Regression Model is likely to lead to an incorrect estimate of the regression relationship between the dependent and the dependent variables, and mainly the independent variable, which in this case is Vs. 30. Therefore, inaccurate assumption that could lead to the misapplication of the regression model is a common facet in literature and has majorly led to coming up with a wrong assumption in the field. Therefore, the researcher of this study was keen enough not to engage in such practises that might jeopardise the whole study, especially in terms of validity, and authentication.
Wald and Allen (2007), recommended for topographic slopes as a major proxy site categorisation. The researchers suggested that using their recommended framework can help in giving a first-order approximation of Vs30 that is linked to large uncertainty, especially in areas where there are no exhaustive geographical maps available. Lemoine et al (2007) examined whys some data collected or rather points by Wald and Allen were awfully estimated, and concluded that the challenge is major because of the sites in sedimentary business, those whose dimensions are not enough to feature in the spatial resolution that is around 1 km, and also to coastal sites due to the fact that the slope calculations in such regions can be biased because of the boundary situations of the DEM. In such a case, Laurendeau, Cotton, Ktenidou, Bonilla, & Hollender (2013) suggested that a more efficient DEM can be applied.
The topographical slope acts a topographical measure that is reliant on the resolution of the DEM applied, that is, the higher the resolution, the higher the local slope. Shifting the spatial resolution of the DEM implies that the correlation between the slope and VS30 ought to be modified. Allen and Wald (2009) applied the 9- arcsec DEM that recovers finer-scale shifts of the terrain, although it introduces more noise. Even so, they did not find any improved results in regards to the 30-arcsec DEM and suggested that larger resolutions (SRTM 30) have the potential of giving more stable Vs30 approximations. Besides, Roulle et al. (2010) also investigated DEMs and DTMs of different scales and sources and established that there are no clear or enhanced systems of results with refined resolutions.
Conclusion
In conclusion, small topographic heterogeneity cannot be effectively represented by slopes calculated from STRM 30. However, it is clear that the higher resolution DEMS are not likely to enhance results but could lead to course estimations majorly because of the canopy or local heterogeneities. The comparison sites used by Wald and Allen (2007) with those determined in an implicit micro-zonation reveals that in this instance, slopes could be underestimated, especially those that are close to water bodies or in coastal regions and that class B site in Lemoine et al. (2009) were likely to be misclassified. Optionally, sites that are within the coastal region or water bodies ought not to be used or a DEM that combines bathymetric and topographic data ought to be used. The geological map that has been used to classify these sites applied on a European wide scale. Every VS30 coordinate used in this study has a direct or direct link to the lithological class. It is also a fact that larger uncertainties are also linked with such associations due to the fact that it does not account for small geological heterogeneities. It is also expected that soil with smaller grains is also linked to shallower slopes. Besides, it seems that there is no sufficient data on plateaus caused by volcanic activities or flat carbonate rocks. Wald and Allen wrote that for these terrains, Vs30 approximations from the slopes are likely to be underestimated. It is also clear that Lemoine et al. (2009) had more outliers as compared to the data collected by Wald and Allen (2007), majorly due to the fact that SRTM30 cannot resolve small basins in hilly or mountainous sites, which are very common in Europe. Besides the kind of International database of geophysical parameters used in Lemoine et al. (2009) seems to be heterogeneous because of the various measurement techniques. However in this study the confusion matrix gave a larger error magnitude to establish conclusive results
The importance of the Vs30 framework can only be authenticated in the context of its intended use. This methodology was originally used with the intention of giving an unambiguous definition of site classes and its subsequent coefficients for a simplified procedure to appropriate site-dependent reaction spectra to be applied in the building of provision codes of NEHRP in 1994. In realisation of its constraints of a single parameter to entirely characterise the reaction of a site, it was recommended and a codified procedural process to provide the option to use, complete and detailed Vs. profiles with matching modulus degradation and damping ratio curves to establish an enhanced estimate of site response as a function of the period. Therefore, for code related applications, in cases where there is a question in regards to the sufficiency of Vs30 for the sake of developing a site-specific design spectrum code procedure help in thriving the option to use a complete Vs. profile. The correlations of Vs30 with physical properties, geologic age, and topographic slope help in giving useful proxies when mapping Vs30 coordinates as a parameter to distinguish broad regional variation in site response. These maps are essential in preparing ShakeMaps and probabilistic Seismic Hazard maps for some applications.
Summary
The study evaluated the performance of VS30 developed from various proxies such as the Nevada sites and the NGA-West databases, among others. The study used the model that was used by Lemoine et al. (2012), in evaluating the 706 sites in Europe on the topographic slope that was implemented by Allen and Wald (2007) and the model was majorly based on the geologic analogous that were modelled by Wills and Clahan (2006) to be used in California as applied by Silva et al. (2015). All these models display an unbiased residual between estimations and measured Vs30 values. Even so, their performance in reference to the data collected on various sites defined unit is highly irregular. The model founded on the topographic slope was biased on some sites as states in the report and unbiases on others.
The study found that the model based on topographic-slope overall presents a spurious spatial variation of Vs30. A positive feature about this methodology is that it comes as an effortless framework that can be used to partially identify E sites, which are majorly characterised by lower values of Vs30 in respect to other sites such as A/B and C. The framework founded on geological analogues is unbiased for both A/B and E locations but is severely biased for C sites. The bias section is related to the challenges linked with the correlation of various sites from different sections with various geological and lithological segments. Because of these challenges, the usefulness of this framework approximating Vs30 is perceived in a qualitative sense.
Recommendations
Based on the results from this study, the researcher reiterate the recommendation made by Wald and Allen (2007), that the classifications of sites based on Vs30 slope correlation ought to be used only for national and regional cases. Besides, it should only be used when there is no enough data, and not for locations with small relative to the DEM resolution, basins or any spatial condition that could affect the outcome of the study. In the case of Reno Nevada the site classifications there were some erroneous estimations, which could lead to various inaccuracies in the future. Therefore, future studies on this location should be focused on unveiling the error in various sites within the Reno Nevada region. Those sites with a bigger error margin should be re-evaluated for future studies and for the sake of finding the best results possible. Additionally, the slope constraints that are used in estimating Vs,30 are dependent on the slope-calculation algorithm, which means that any miscalculation when the slope algorithm could affect the outcome of the whole study. Therefore, researchers need to pay attention to the slope-calculation algorithm.


References
Akkar, S., Sandıkkaya, M.A., and Bommer, J.J., 2014. Empirical ground-motion models for point-and extended-source crustal earthquake scenarios in Europe and the Middle East. Bulletin of earthquake engineering, 12(1), pp.359-387.
Atkinson, G.M., 2009. Earthquake time histories compatible with the 2005 National building code of Canada uniform hazard spectrum. Canadian Journal of Civil Engineering, 36(6), pp.991-1000.
Baker, J.W., and Cornell, C.A., 2006. Pacific earthquake engineering research center. University of California, Berkeley.
Boore, D. M., Stewart, J. P., Seyhan, E., & Atkinson, G. M. (2014). NGA-West2 equations for predicting PGA, PGV, and 5% damped PSA for shallow crustal earthquakes. Earthquake Spectra, 30(3), 1057-1085.
Boore, D. M., Thompson, E. M., & Cadet, H. (2011). Regional correlations of VS 30 and velocities averaged over depths less than and greater than 30 meters. Bulletin of the Seismological Society of America, 101(6), 3046-3059.
Borcherdt, R.D., 1992, November. Simplified site classes and empirical amplification factors for site-dependent code provisions. In Proc. NCEER, SEAOC, BSSC Workshop on Site Response during Earthquakes and Seismic Code Provisions (pp. 18-20). University of Southern California, Los Angeles, California.
Campbell, K.W. and Bozorgnia, Y., 2003. Updated near-source ground-motion (attenuation) relations for the horizontal and vertical components of peak ground acceleration and acceleration response spectra. Bulletin of the Seismological Society of America, 93(1), pp.314-331.
Delavaud, E., Scherbaum, F., Kuehn, N., and Allen, T., 2012. Testing the global applicability of ground‐motion prediction equations for active shallow crustal regions. Bulletin of the Seismological Society of America, 102(2), pp.707-721.
Dobry, R., Borcherdt, R.D., Crouse, C.B., Idriss, I.M., Joyner, W.B., Martin, G.R., Power, M.S., Rinne, E.E. and Seed, R.B., 2000. New site coefficients and site classification system used in recent building seismic code provisions. Earthquake spectra, 16(1), pp.41-67.
Erdik, M., Şeşetyan, K., Demircioğlu, M.B., Hancılar, U., and Zülfikar, C., 2011. Rapid earthquake loss assessment after damaging earthquakes. Soil Dynamics and Earthquake Engineering, 31(2), pp.247-266.
Goda, K., Kiyota, T., Pokhrel, R.M., Chiaro, G., Katagiri, T., Sharma, K., and Wilkinson, S., 2015. The 2015 Gorkha Nepal earthquake: insights from earthquake damage survey. Frontiers in Built Environment, 1, p.8.
Johnston, A. C. 1996. Seismic moment assessment of earthquakes in stable continental regions—III. New Madrid 1811–1812, Charleston 1886 and Lisbon 1755. Geophys. J. Int 126 314–344.
Martin, S., and Szeliga, W., 2010. A catalog of felt intensity data for 570 earthquakes in India from 1636 to 2009. Bulletin of the Seismological Society of America, 100(2), pp.562-569.
Marzocchi, W., Lombardi, A.M., and Casarotti, E., 2014. The establishment of an operational earthquake forecasting system in Italy. Seismological Research Letters, 85(5), pp.961-969.
Medina, R., and Krawinkler, H., 2004. Pacific earthquake engineering research center. University of California, Berkeley.
Pancha, A., Anderson, J.G. and Louie, J.N., 2007. Characterization of near-surface geology at strong-motion stations in the vicinity of Reno, Nevada. Bulletin of the Seismological Society of America, 97(6), pp.2096-2117.
Pilz, M., Parolai, S., Picozzi, M., Wang, R., Leyton, F., Campos, J., and Zschau, J., 2010. Shear wave velocity model of the Santiago de Chile basin derived from ambient noise measurements: a comparison of proxies for seismic site conditions and amplification. Geophysical Journal International, 182(1), pp.355-367.
Seyhan, E., Stewart, J. P., Ancheta, T. D., Darragh, R. B., & Graves, R. W. (2014). NGA-West2 site database. Earthquake Spectra, 30(3), 1007-1024.
Shaw, J.H., Plesch, A., Tape, C., Suess, M.P., Jordan, T.H., Ely, G., Hauksson, E., Tromp, J., Tanimoto, T., Graves, R. and Olsen, K., 2015. Unified structural representation of the southern California crust and upper mantle. Earth and Planetary Science Letters, 415, pp.1-15.
Stewart, J.P., Douglas, J., Javanbarg, M., Bozorgnia, Y., Abrahamson, N.A., Boore, D.M., Campbell, K.W., Delavaud, E., Erdik, M. and Stafford, P.J., 2015. Selection of ground motion prediction equations for the Global Earthquake Model. Earthquake Spectra, 31(1), pp.19-45.
Wald, D.J., and Allen, T.I., 2007. Topographic slope as a proxy for seismic site conditions and amplification. Bulletin of the Seismological Society of America, 97(5), pp.1379-1395.
Wills, C.J. and Silva, W., 1998. Shear-wave velocity characteristics of geologic units in California. Earthquake Spectra, 14(3), pp.533-556.
Continue your journey with our comprehensive guide to Corpus-Based Analysis of Synonyms 'Plead' and 'Beg' in English.


- 24/7 Customer Support
- 100% Customer Satisfaction
- No Privacy Violation
- Quick Services
- Subject Experts