Advancing Cancer Research Treatment and Support in the United States
Introduction
National Cancer Institute
The National Cancer Institute (NCI) acts as a part of the National Institutes of Health (NIH) and coordinates the execution of the United States National Cancer Program. The NICI is involved in conducting and supporting research, dissemination of health information, training and others related to the causes, diagnosis, treatment and prevention of any form of cancer. It acts to form supportive care needed for cancer patients and their families along with providing guidance for cancer survivorship (cancer.gov, 2021). The NIC fulfil most of its mission through an extramural program that offers grants for research regarding cancer (cancer.gov, 2021).

Drug Development Therapy
The Drug Development Therapeutics Program (DTP) by NCI offers resources and services to the academic as well as private-sector research communities over the world for facilitating discovery as well as the development of innovative and new therapeutic agents for cancer. Since its initiation, DTP has led to more than 40 US anti-cancer agents to be developed through extensive collaboration formation with pharmaceutical, academic and biotechnology industries along with Romidepsin, Paclitaxel, Sipulecuel-T, Eribulin and Dinutuximab (dtp.cancer.gov, 2021).
Special Concentration Parameters of Drugs
The IC50 value indicates the concentration of drug which causes 50% inhibition of the growth of cancer cells. It is changed to GI50 by the NCI for emphasising the correlation of the cell count at time zero while the concentration mentioned for the test drug is 100 × (T - T0)/(C - T0) = 50. T is signified as the optical density for the text well of test drug after 48-hour exposure, T0 is the optical density measured at time zero and C is indicated as the control optical density (dtp.cancer.gov, 2021a). The 50 is indicated as the GI50PRCNT which a T/C-like parameter is probable to have values from -100 to +100 leading to inform GI50 is the measurement of the growth inhibition power of the agent for testing. However, TGI indicates the drug concentration for the test where 00 × (T - T0)/(C - T0) = 0. Therefore. TGI mainly signify any cytostatic impact while LC50 indicates cytotoxic effect. In calculating the LC50, the control optical density is not implemented. The mentioned parameters for concentration are interpolated values in which GI50PRCNT values are used above and below the reference values (50 for GI50) for making interpolations on the concentration axis (dtp.cancer.gov, 2021a).

COMPARE Algorithms
COMPARE analysis is referred as the rank-ordered list for compounds in which each compound from one of the different specially prepared databases based on the similarity of its in-vitro growth pattern to in-vitro pattern of growth for selected seed compound are ranked. In order to identify COMPARE rankings, the scaler index similarity between the growth pattern of the seed compound and growth pattern for each of the compounds in the COMPARE data are created. The two-similarity index, average difference between correlation coefficient and deltas are to be described later. Before the correlation coefficient method (CCM), the reporting and development of average difference method (ADM) is done and the preparation of the database procedure for the ADM provides a useable database with the help of either of the method. Thus, the later description of the database is those which are needed by the ADM and CCM can implement use of the databases. However, the mathematical characteristics related with the method makes the delta computation unnecessary (dtp.cancer.gov, 2021b).
Pearson product-moment correlation
The Pearson product-moment correlation is referred to as the measurement of strength of linear association between two different variables indicated by r. The correlation mainly attempts to chart a line that best fit for the data of both the variable and the r indicates the extent to which the data points are from the line of best fit (Humphreys et al., 2019). Pearson co-efficient values range from +1 to -1 and a value of 0 indicate lack of any association between the two selected variables. The achievement of +1 or -1 value indicates all the data points of the two variables are included on the line of best fit and there are no data points present that are showing variability away from the best fit line. The values present between +1 to -1 such as r=0.8 or -0.4 informs there are variation present around the line of best fit and the closer the vale of r is to 0, the greater level of variation in the line of best fit is expected. The “+” value indicates as positive relationship between the two variables where as “-“value indicates negative correlation between the independent and the dependent variables. The Pearson correlation can be used to only develop strength of any linear association between two variables and cannot be used for determining cause-effect relationship (Asri et al., 2017).
The two variables to be used in the Pearson’s correlation needed to be measured on interval or ratio scale, but they are not required to be measured through the same scale indicating one can be interval and another ratio. Moreover, the two variables to be compared can have different units (Obilor and Amadi, 2018). In Pearson correlation, it does not consider whether or not a variable is indicated as dependent or independent as it views all the variables as equal. In order to calculate Pearson correlation, assumptions are made that are mainly of seven types. The valid or accurate results from the Pearson correlation is developed when the study design and the data pass all the seven assumptions underpinned for the process (Asri et al., 2017).
The first assumption made is that the two variables to be measured are on a continuous scale that is either on interval or ratio level. For example, exam score of 0-100 or driving speed in km/h and others (Statistics, 2018).
The second assumption is variables determined are to be paired which indicates that each of the cases are going to have two values which can also be referred as data points (Statistics, 2018).
The third assumption is that the variables are to be independent of cases that means both the observation for one of the cases is to be independent of the two observation of any other case.
In case the observations are related and not independent, then the Pearson correlation would not be effective statistical test for the condition (Statistics, 2018).
The fourth assumption is that between the two continuous variables, a linear relationship is to be present and for testing their linear condition, the variables are to be plotted in a graph and to be visually examined (Statistics, 2018).
The fifth assumption is that both of the variables are to follow a bivariate normal distribution even though the presence of univariate normality of both continuous variables is considered to be sufficient in practice that is each variable has normal distribution. In case either or both the variables do not support being normally distributed, then a disagreement is developed whether Pearson’s correlation has still effective ability in delivering valid results in the study (Statistics, 2018).
The sixth assumption is homoscedasticity that indicates variances present along the line of best fit is considered to remain similar as one move along the line. In case variances are dissimilar, heteroscedasticity is developed (Statistics, 2018).
The seventh assumption is that no multivariate or univariate outliners are present. The outliners are referred as observation in the sample which violates following a similar pattern in regard to the rest of the data. The outliners can be detected by simply plotting the values on the graph and inspecting their wayward points. They are required to be removed to gain better accuracy in the statistical analysis of the values from the graph (Statistics, 2018).
Anti-cancer components
The NSC 753790 is indicated as compound 2a which express moderate to enhanced correlation of 0.51 with the NQO1 activity. The compound 2a has structural similarities with compound 15 and 16 which leads to determine that structural features of the compounds create greater influence of activating the molecules. The compound 2a along with other two compounds 15 and 16 are found to have flat aromatic molecules with presence of p-stacking capabilities. They have additional groups present that support hydrogen bonding capability and iminoquinone moiety is regarded as the key significant structural feature related to compound 2a (Fagan et al., 2012).
The enzyme NQO1 is regarded as potential target for making personalised medicines and it is found as overexpressed enzymes in most of tumours. In case of normal cells, the NQO1 is expressed in induced manner and its key role is detoxify the quinones through bioreduction process. However, certain quinones tends to become more toxic after being reduced by NQO1 and the compounds are found to have greater potential as selective anti-cancer agents (). The mechanism of action of NQO1 as anti-cancer agent is nature of ping-pong mechanism because both the quinone substrate and NAD(p)H independently occupies the same site of binding. During the catalytic phase, NQO1 has flavin adenine dinucleotide (FAD) redox cofactor which keeps on binding with NQO1 protein. The FAD cofactor is later reduced to FADH2 by NAD(P)H, and the NAD(P)+ is later lost. It makes space for the quinone substrate to enter the active site and reduces the hydroquinone by FADH2 which results the substrate to be removed as hydroquinone leading to regenerate the NQO1 enzyme for further action (Parkinson et al., 2013).

The 1,3-diphenylbenzo[1,2,4]triazin-7-ones 1a-1l is referred as NSC 768093 which initiates from 1-phenyl-3- (trifluoro-methyl)benzo[1,2,4]triazin-7-one (NSC 780813) and 1,3-diphenylbenzo[1,2,4]triazin-4-yl radical. In NCI, it is seen that one dose (10µM) of 1,3-diphenylbenzo[1,2,4]triazin-7-ones 1a-1l express strong inhibition of growth in various cancer cells namely colon, leukaemia, renal and melanoma cancers (). In the NCI databased, out of 70,000 compounds it is found that pleurotin has the highest correlation co-efficient to benzothiazine 1a recorded at 0.84 Pearson coefficient which shows a strong correlation (Sweeney et al., 2016).
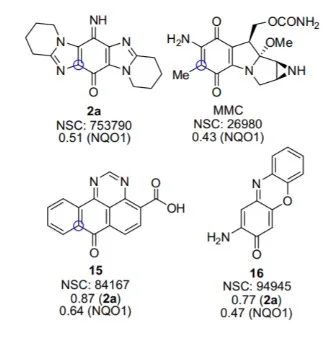
Figure 1: Five dose data for iminoquinone 2a expressed as pearson correlation coefficients
![Benzo[1,2,4]triazin](https://www.dissertationhomework.com/img/nk141.webp)
References
Asri, M., WNS, M.D. and Ismail, D., 2017. Source Determination of Red Gel Pen Inks using Raman Spectroscopy and Attenuated Total Reflectance Fourier Transform Infrared Spectroscopy combined with Pearson's Product Moment Correlation Coefficients and Principal Component Analysis. Journal of forensic sciences, 63(1), pp.285-291.
cancer.gov 2021, National Cancer Institute, Available at: https://www.cancer.gov/about-website [Accessed on: 27 November 2021]
dtp.cancer.gov 2021, Developmental Therapeutics Program, Available at: https://dtp.cancer.gov/ [Accessed on: 27 November 2021]
dtp.cancer.gov 2021a, Screening Procedures, Available at: https://dtp.cancer.gov/databases_tools/docs/compare/compare_methodology.htm [Accessed on: 27 November 2021]
dtp.cancer.gov 2021b, COMPARE Analysis, Available at: https://dtp.cancer.gov/databases_tools/compare.htm [Accessed on: 27 November 2021]
Fagan, V., Bonham, S., Carty, M.P., Saenz-Méndez, P., Eriksson, L.A. and Aldabbagh, F., 2012. COMPARE analysis of the toxicity of an iminoquinone derivative of the imidazo [5, 4-f] benzimidazoles with NAD (P) H: quinone oxidoreductase 1 (NQO1) activity and computational docking of quinones as NQO1 substrates. Bioorganic & medicinal chemistry, 20(10), pp.3223-3232.
Humphreys, R.K., Puth, M.T., Neuhäuser, M. and Ruxton, G.D., 2019. Underestimation of Pearson’s product moment correlation statistic. Oecologia, 189(1), pp.1-7.
Obilor, E.I. and Amadi, E.C., 2018. Test for significance of Pearson’s correlation coefficient. International Journal of Innovative Mathematics, Statistics & Energy Policies, 6(1), pp.11-23.
Parkinson, E.I., Bair, J.S., Cismesia, M. and Hergenrother, P.J., 2013. Efficient NQO1 substrates are potent and selective anticancer agents. ACS chemical biology, 8(10), pp.2173-2183.
Statistics, L., 2018. Pearson’s product-moment correlation: Assumptions. Lund Research.
Sweeney, M., Coyle, R., Kavanagh, P., Berezin, A.A., Re, D.L., Zissimou, G.A., Koutentis, P.A., Carty, M.P. and Aldabbagh, F., 2016. Discovery of anti-cancer activity for benzo [1, 2, 4] triazin-7-ones: Very strong correlation to pleurotin and thioredoxin reductase inhibition. Bioorganic & medicinal chemistry, 24(16), pp.3565-3570.
Dig deeper into Addressing the Challenge of Conveying Unpleasant News in Management with our selection of articles.


What Makes Us Unique
- 24/7 Customer Support
- 100% Customer Satisfaction
- No Privacy Violation
- Quick Services
- Subject Experts