The use of Oral Glucose Tolerance Test to measure blood glucose levels and its importance towards diagnosing diabetes
Abstract
Background:
Diabetes Mellitus is a metabolic disorder characterized by insulin impairment. Oral glucose tolerance test (OGTT) is used for the diagnosis of diabetes because of its convenience and ability to detect complications. Students seeking to understand the complexities of this condition might benefit from healthcare dissertation help, which can provide insights into the latest research and clinical practices related to diabetes management.
Aims and Objectives:
The aim of this study was to measure and compare the blood glucose levels and study its impact on insulin secretion in different subjects and volunteers. Further to determine if they are diabetic or to evaluate their chance of developing this disease (pre-diabetic).
Continue your exploration of Blood with our related content.
Methods:
In the current study, OGTT was used to determine the blood glucose levels in 5 different patients (A, B, C, D and E) and 4 healthy volunteers over a two-hour time period. Glucose levels were determined by Glucose-oxidase and peroxidase (GOD-POD) method. Volunteer’s blood levels were measured using Glucose meters.
Dig deeper into Tokugawa Regime with our selection of articles.
Dig deeper into Lab Safety for Bleach Spills with our selection of articles.
Results:
Post ingestion of oral glucose, for the first 30 min all patients showed an increase in their blood glucose levels. The highest value observed was 19.60mM and the lowest 2.92mM. In case of volunteers the highest value was 11.70mM and the lowest was 4.20mM. 75% of the volunteers showed an increase in the glucose levels after the first ingestion of glucose.

Conclusion:
OGTT is helpful in identifying people with diabetes, however it may not detect diabetes in some cases. Among all patients, A was normal, B was prediabetic, C was diabetic, D was insensitive to glucose absorption and E showed hypoglycaemia. All the volunteers were healthy. Further, glycosylated haemoglobin (HbA1c) test should be performed for confirmation of diabetes among patients with OGTT greater than 6-7 mmol/L.
Continue your exploration of Key Roles in Blood Coagulation and Beyond with our related content.
Word count: 249
Keywords:Diabetes mellitus, Hyperglycemia, Insulin, Oral Glucose Tolerance Test
Abbreviations:
- Diabetes Mellitus (DM)
- Glucose oxidase and peroxidase (GOD-POD)
- IGT (Impaired Glucose Tolerance)—is it abbreviation required. Since its not used in current report
- MODY (Maturity Onset Diabetes of the Young)
- OGTT (Oral Glucose Tolerance Test)
Introduction
Diabetes mellitus
Diabetes mellitus is a metabolic disorder characterized by dysregulation of plasma glucose levels, observed to be >100mg/dl. There are two main types (1 and 2). Type 1, also (juvenile onset diabetes) represents 10% of cases, is a progressive autoimmune destruction of pancreatic β-cells (insulitis). Type 2 (adult onset diabetes) is observed in 90% of cases and is due to insulin resistance in peripheral tissues.(American Diabetes Association, 2004 ) Moreover, there are two more types of diabetes: Maturity Onset Diabetes of the Young (MODY) (Stefan SF & Graeme IB, 2011 )and gestational diabetes. MODY involves single gene mutations while gestational diabetes is a temporary condition where pregnant mothers develop insulin resistance.
Recent estimates indicate that there are more than 350 million people in the world with diabetes and is estimated to increase to 550 million by 2030 (WHO, 2015). Hyperglycaemia is one symptom of diabetes in which blood glucose levels surpass the renal threshold inflicting osmotic pressure which in the short-term can lead to microvascular damages such as retinopathy, neuropathy and nephropathy (NHANES, 2007). Furthermore, there is also an increased risk of macrovascular complications in the long-term such as ischaemic heart disease, and stroke.
Oral Glucose Tolerance Test
OGTT is performed to measure the ability of the body to regulate glucose after the ingestion of a drink containing sugar. Glucose is the primary fuel in humans and is metabolized by glycolysis and oxidative phosphorylation. During metabolism it leads to the production of energy (ATP). People with diabetes will not be able to tolerate increased glucose intake and their levels may not decrease (Diabetes UK). Instead of glucose, Lucozade is also used in the experiments including in our set up. It contains 65.4 grams of carbohydrates of which 33.1 are sugars. It’s components will initially be digested in the mouth by α-amylase and then by a homologous enzyme in the small intestine. This glucose is stored in liver or adipose tissues under the influence of insulin hormone by yielding energy to cells (Figure 1).
OGTT results indicate whether the individual is prediabetic, diabetic or normal. The current WHO diagnostic criteria for diabetes are fasting plasma glucose ≥ 7.0mmol/l (126mg/dl) or 2hr plasma glucose ≥ 11.1mmol/l (200mg/dl). There are three different versions of the test: 1-hour test, 2-hour test and 3-hour test (Kinman, 2016 ).

Pancreatic cells secrete insulin which initiates fusion of the intracellular GLUT transporters to the plasma membrane in tissues (e.g. liver, adipose tissue). The effect is the passage of glucose in the cytoplasm of the cell. It is oxidized by glycolysis and oxidative phosphorylation pathway which eventually leads to energy production.
Aims and Objectives:
In the current study, OGTT was utilized to determine blood glucose levels and their impact on insulin secretion. We compared plasma glucose levels in different patients and healthy volunteers during the two-hour period.
Materials and Methods
The individuals included in this study had to fast prior to OGTT. Only intake of water was permitted during fasting period. At 0-minute blood sample were drawn and analyzed to give a baseline reading. Thereafter, the patients are asked to ingest Lucozade and blood test for glucose determination were done at time intervals of 15, 30, 60, 90 and 120 minutes.
A) Determination of blood glucose levels in the patients
Fasting blood samples (10-16 hours) were collected from patients A, B, C, D and E. The collected blood samples were deproteinized due to which the original blood samples were diluted at 20-fold. Each deproteinized blood sample was analyzed in duplicates to avoid procedural errors and uncertainty. Both, glucose standards and patient’s blood samples were determined using GOD-POD method. A calibration curve of absorbance versus standard blood glucose concentration was constructed to determine glucose concentration in patient’s sample.
In brief the principle of GOD-POD is that the Glucose oxidase enzyme catalyzes the conversion of glucose to give gluconic acid and hydrogen peroxide. In the second step, the hydrogen peroxide is broken down to water and oxygen by peroxidase enzyme. Oxygen reacts with 4-Aminophenazone (oxygen acceptor) in the presence of phenol to form a pink coloured compound which is determined at 505-530nm.
β-D-glucose + H2O + O2 ⇒ D-gluconolactone + H202(hydrogen peroxide)
2H2O2 + Phenol + 4-aminophenazone ⇒ colored complex + 4H2O
B) Determination of blood glucose levels in healthy volunteers using glucose meters (Figure 2)
Post fasting >12 hrs, blood samples were collected from volunteers and glucose levels were measured using glucose meters in mmoles per liter. The samples were collected through punctures on the volunteers’ fingertip and blood was applied to the end of the stick to fill the capillary of the meter. The subjects had to wash and clean their fingers with alcohol before every measurement (sterile environment).

Figure 2: Blood glucose meters:
The components are highlighted. The blood sample is applied at the sample end or tip of the test strip. After a few seconds, the blood glucose value is seen on the screen.
Results
Table 1: Chart for Standardization of GOD-POD method


Volume and concentration of glucose are depicted in the first two columns. Their values are proportional to the absorbance and to the mean absorbance.
Table 1 shows a positive correlation where concentration of standard glucose increases with increase in absorbance.
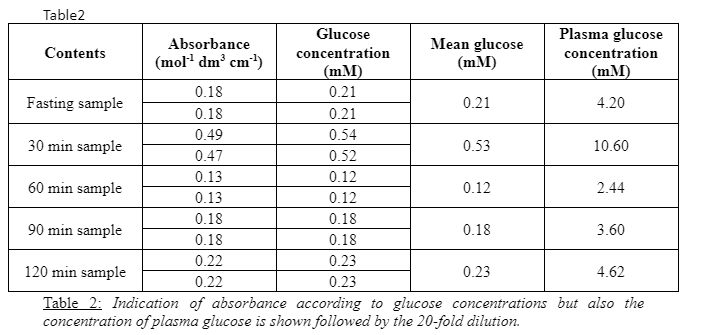
As illustrated in Figure 3, the calibration curve allowed to determine the unknown blood glucose concentration. As shown in Table 2, due to 20–fold dilution, the mean glucose concentration was multiplied by 20 to calculate plasma glucose levels.

Figure 3: Standardization of Glucose oxidase-peroxidase method for determination of glucose
Calibration or standard curve of absorbance versus concentration of glucose. A straight line indicates a linear correlation between the two variables.


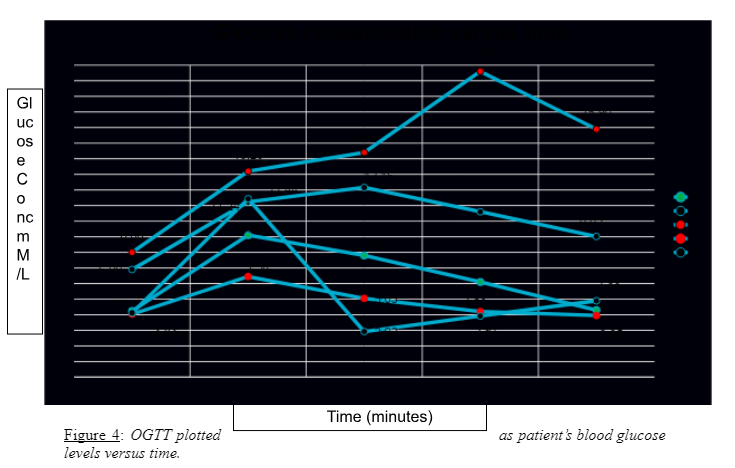
Figure 4 shows the results of OGTT for patients A, B, C, D and E. All patients showed an increase in blood glucose levels from 0th min to the first 30 minutes.
- Patient C’s OGTT curve started at 8.0 mM and settled at 15.90 mM with the peak blood glucose levels at 19.60 mM at 90 minutes.
- Patient B’s OGTT curve started at 6.90 mM and showed a final value of 9.02 mM with a highest value of 12.16 mM.
- Patient E showed an initial value of 4.25 mM reached the highest value of 11.24 mM. This was followed by the greatest decrease in value of 2.92 mM with a final value of 4.90 mM.
- Patient A started with a lowest value of 4.25 mM. It showed a rapid increase to value of 9.10 mM within first 30 minutes.
- Patient D started with a value of 4.04 mM and stopped at value of 3.95 mM at 120 minutes. This patient reached the maximum value of 6.45 mM.

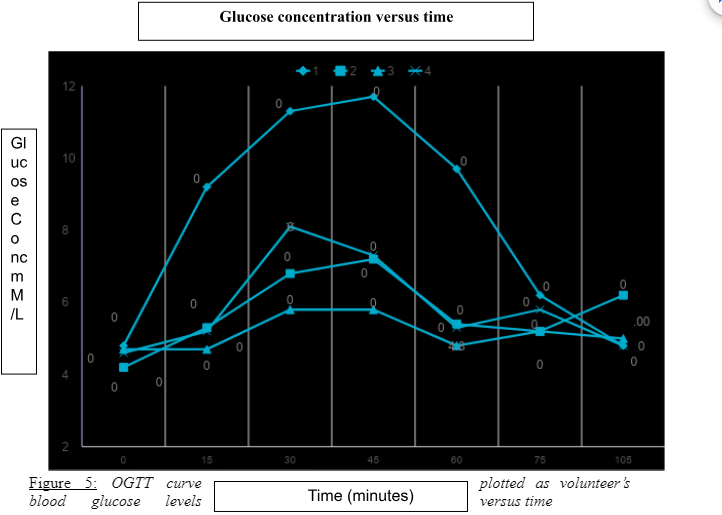
Figure 5 shows the OGTT results obtained from volunteers.
- The blood glucose levels for volunteer 1 rapidly increased from 4.80mM to 9.20mM with highest value of 11.70mM at 45 minutes.
- Volunteer 2 showed the lowest value of 4.20mM at the 0th min and a peak of 7.20 mM at 45 minutes and showed a final value of 4.80mM at 90 minutes.
- Volunteer 3 showed the initial value of 4.70mM with no increase from 0 to 30 min. Further, it showed a slight increase to 5.80mM at 45 minutes.
- Volunteer 4 started with the lowest value of blood glucose at 4.70mM which reached the highest value of 8.10 mM at 30 minutes and showed a final value of 4.80mM.
- The volunteers 2, 3 and 4 showed an increase at 60 minutes but their values did not surpass substantially the initial values.

Discussion
Our results revealed that patient C’s OGTT curve never subsided. It reached highest glucose level of 19.6 mM and after 90 minutes it was at 15.90 mM. This result indicated that the patient was diabetic, since glucose was not metabolized the curve never plateaued. Blood glucose levels for patient B ranged from 6.90 mM to 9.02 mM. The levels did not subside at 90 minutes too and showed a value of 10.6 mM. This patient may be prediabetic and should be further examined. Patient E showed a dramatic increase after glucose intake. Later, the insulin response caused hypoglycemia with blood glucose values falling to 2.92 mM. Patient A showed a normal response to ingested glucose with a release of insulin as the blood glucose levels returned back to normal within 2hrs. As compared to other patients, Patient D showed the lowest increase in blood glucose levels with an increase to 6.25 mM. This may be attributed to malabsorption of glucose in the small intestine which must have led to less glucose circulation in the bloodstream.
OGTT results for Volunteer 4 revealed that glucose is readily absorbed. The volunteer is sensitive to glucose, since sugar metabolism in the gut caused a vigorous release of glucose in the bloodstream however the levels became normal after 75 minutes. Volunteer 3 was relatively insensitive to glucose absorption since the glucose levels increased to 5.8mM. For volunteers 1 and 2, blood glucose levels were normal. Glucose triggered insulin secretion by pancreas in the bloodstream and brought glucose levels back to normal levels.
Our study indicates that OGTT should be retained as a diagnostic test because fasting plasma glucose alone fails to diagnose approximately 30% of cases of previously undiagnosed diabetes (WHO, 2015; Linda GM, 2010).
OGTT is the only means of identifying people with IGT. It is frequently needed to confirm or exclude an abnormality of glucose tolerance in asymptomatic people.
The diagnosis of chemical diabetes by OGTT isn’t much accepted since it has many pitfalls especially in form of false positives. Due to its limited value OGTT should not be performed in hospital or chronically ill patients. Finally, the detection of glucose intolerance (in fasting normoglycemia) is rarely of benefit to the patient in the absence of obesity and may prove a hardship for psychosocial reasons. The clinician should be very conservative in making a diagnosis of DM based on this test (Kinman, 2016 ). Further, the clinician cannot diagnose hypoglycaemia because the symptoms aren’t expressed.
Conclusion
OGTT is helpful in identifying people with diabetes. However, it has a major limitation that it may not detect certain individuals suffering from diabetes. We need to further validate our results using Glycosylated haemoglobin (HbA1c) test to confirm the presence of diabetes detected in patients with an OGTT greater than 6-7 mmol/L.
Acknowledgments:
We thank Dr. Afshan Malik (King’s College London) and Professor Christofer Hogstrand (King’s College London) for their valuable advice and supervision regarding the experimental procedures. We express our gratitude towards the technicians of Hodgkin Lab B (King’s College London) for their assistance and provision of appropriate information and tools necessary for conducting OGTT and spectrophotometry.
Continue your journey with our comprehensive guide to Acute Porphyria: Symptoms, Causes, and Diagnosis.
References
- American Diabetes Association. (2004 ) Diagnosis and Classification of Diabetes Mellitus. Diabetes care 27: s5-s10.
- Diabetes UK. Diabetes Diagnosing method OGTT.
- Kinman T. (2016 ) Glucose Tolerance Test.
- Linda GM MA, Rydén L. (2010) Diabetes, prediabetes and cardiovascular risk. European Journal of Cardiovascular Prevention & Rehabilitation 17: s9-s14.
- NHANES. (2007) Oral Glucose Tolerance Test (OGTT) Procedures Manual. National Health and Nutrition Examination Survey (NHANES): 1-103.
- Stefan SF & Graeme IB. (2011 ) MODY Diabetes care 34: 1878-1884.
- WHO. (2015) Definition and diagnosis of diabetes mellitus and intermediate hyperglycemia.
- 24/7 Customer Support
- 100% Customer Satisfaction
- No Privacy Violation
- Quick Services
- Subject Experts


