Product Excellence Using Six Sigma
Product Excellence Using Six Sigma
Introduction
Cudney and Furterer (2012) report that globalisation, increasing visibility and instant access to information have changed the manner in which firms conduct business. As such, the contemporary business environment leaves no room for error and organisations are compelled to look for ways to exceed their customers’ expectations. As a result, most firms have employed the Six Sigma process in their activities. Fung (2015) observes that Six Sigma is a highly disciplined process that assists organisations to develop and deliver near-perfect products and services. General Electric (2014) notes that the word “sigma” is a statistical term that measures how far a given process deviates from perfection. highlighting all the importance of statistical analysis in achieving operational excellence, particularly in fields such as statistics dissertation help.
Aims

The aim of this project is to apply the knowledge of tools, methodologies and techniques in solving organisational and operational problems in typical situations.
In this exercise, two components of a propylene plant pump have been failing occasionally which affects the overall plant availability. The provided data requires appropriate analysis to identify suitable maintenance strategies to keep plant availability at 100 percent and reduce the incidences of flaws in products and services. In the following paragraphs, suitable methods are identified and elaborated
Weibull Analysis
In life data analysis, predictions regarding the life of all products in a population are made by fitting a statistical distribution to life data obtained from a representative sample of units. As such, the parameterised distribution can be used in estimation of vital life characteristics of products including the reliability or probability of failure at a given time, the failure rate and the mean life. In this case, the life data for the pumps and their components are gathered. Next, a lifetime distribution that suits the data has been selected to facilitate modelling of the life of the products. Third, parameters that fit the distribution are estimated. Fourth, results and plots that estimate the life characteristics are generated. The Weibull analysis is a distribution model founded on cumulative distribution function (CDF) and probability density function (PDF). The graphical representation of PDF is shown below:
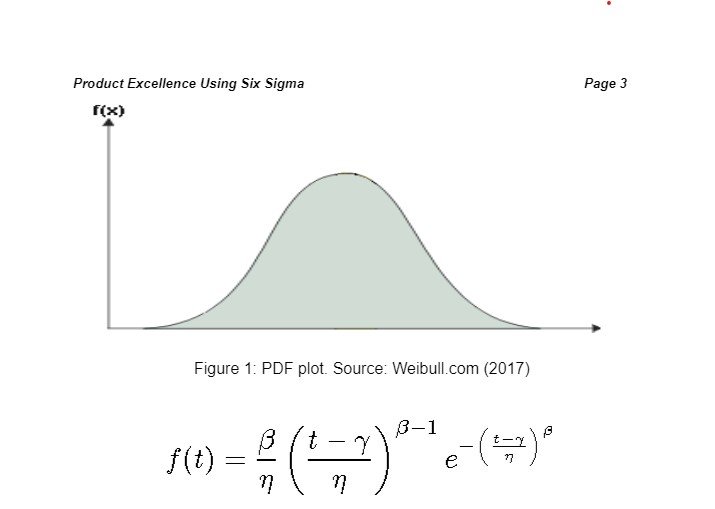
Figure 2: mathematical equation for the PDF of a 3 – parameter Weibull distribution. Source: Weibull.com (2017)
The relationship between CDF and PDF can be summarised in a plot as follow
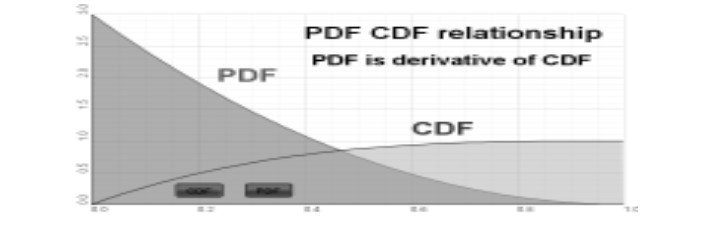
Figure 3: relationship between CDF and PDF
From figure 3, PDF is a derivative of CDF. The area on the left portion determines the likelihood that a given unit will randomly fail at any specified time. Additionally, the area describes the number of units that fail in the given time within a defined population. The extreme right of the figure is the limit within which a unit will surely fail.
Quantitative data
The following table summarises the data obtained from the plant
Product Excellence Using Six Sigma
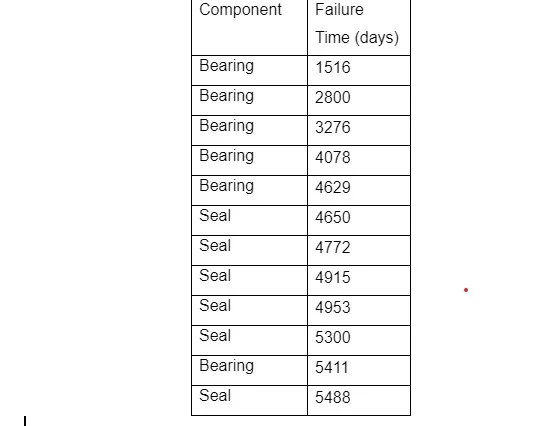
Table 1: summary of primary dat
From the table above, there are 12 instances of failure. Half are seal failures while the other half is bearing failure. Given that the sample size is significantly less than 50, F(t) values can be plotted using a ranked failure time to provide cycles with ranks to allow calculation of a median rank as follows: Median rank= Rank-0.3n+0.4for each rank
After obtaining the median rank, the logarithmic value can be calculated as follows: logarithmic value=11-median rank
Data Modelling
The following procedure was followed when modelling the data using Ms Excel. First, failure cycles of bearings were entered in a worksheet in the first column in a rank from the lowest to highest cycle failures. Next, the cycles were given arbitrary values ranging from 1 – 6 according to their numeric value. Third, the proportion of total bearings expected to fail by the end of complete cycles was calculated using median ranks. Fourth, data was manipulated using various formulas as shown in the following table:
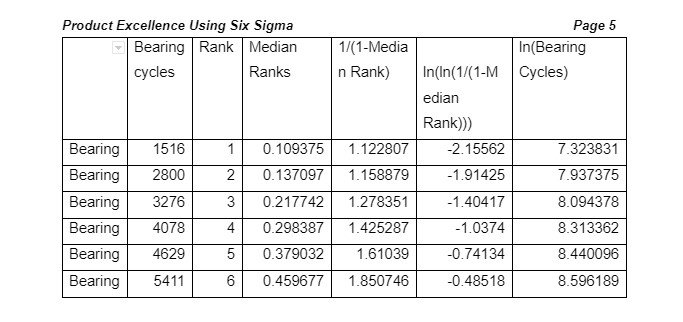
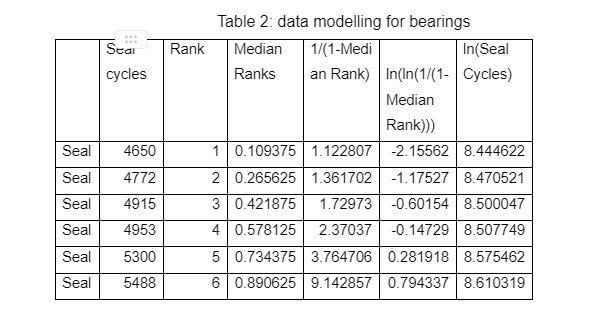
Table 3: Data modelling for seals
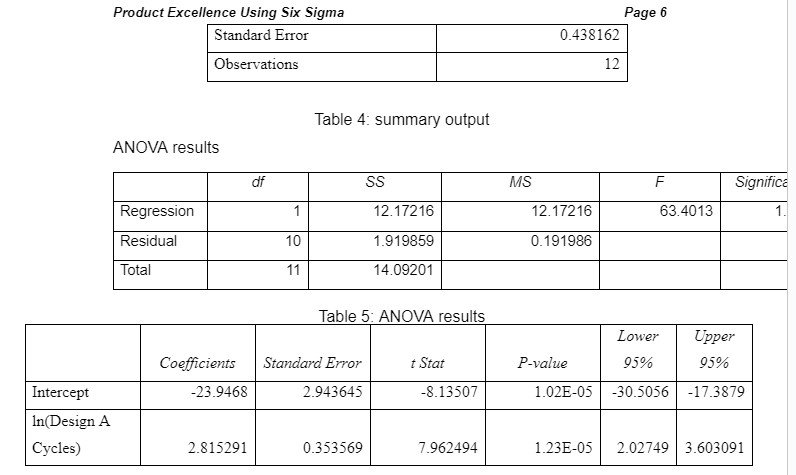
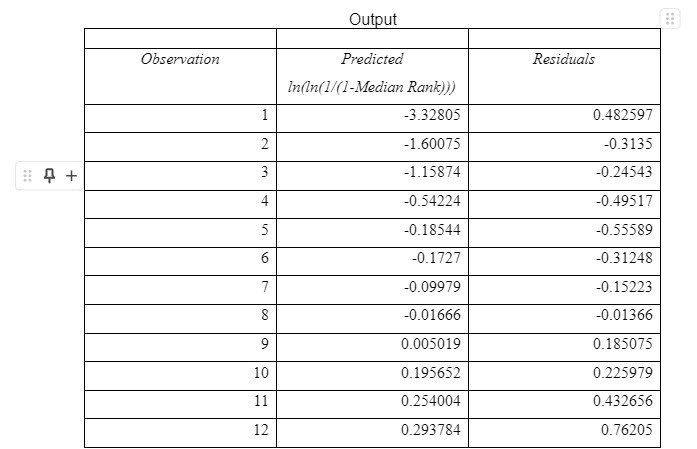
Afterwards, linear regression was performed for predictive analysis. The test was important in establishing the relationship between variables to allow for making informed inferences regarding the availability of seals and bearings. Regression analysis provided “α” and “β” values which were used in decision making. In both cases, inputs were taken from the fifth and sixth columns containing 1/ (1-Median Rank) and ln (ln(1/(1-Median Rank))) respectively. The summary output and other regression results are shown below
Summary output


Interpretation of results
α is the life attribute value of the distribution that is used for measuring the range of the data distribution. Alpha value can be used to understand if the distribution follows the weibulls. The alpha values of the two distributions of seals and bearings data are different and thus, can be interpreted differently as follows:
Alpha Valu
α is the life attribute value of the distribution that is used for measuring the range of the data distribution. Alpha value can be used to understand if the distribution follows the weibulls. The alpha values of the two distributions of seals and bearings data are different and thus, can be interpreted differently as follows:
Seal: The value of alpha for seals failure data is 0.1435 which greater than the p-value of the distribution which is 0.06 suggesting that the data follows Weibull distribution
Bearing: The value of alpha for bearings is 0.0089 which is also more than the significance value of distribution that is 0.0025 and thus, it can be said that even the bearing failure data follows Weibull distribution (Al-Fawzan, 2000) The alpha values can be used to justify the choice of weibull analysis for study of the current scenario.
Beta Value
Different Beta vales were obtained for Seal and Bearing. Thus, values of them can have different interpretations as follows:
Seal: As the value of β for Seal in the current scenario is greater than 1 but less 4, it implies that the failure of seals is mainly due to the early wear out. The reasons behind these wear outs could be fatigue, corrosion, or erosion. If such a failure has to be prevented from occurring then a rework has to be done by altering of the materials that form these bearings and seals. Degradation of them has to be managed and at the same time, operational practices have to be controlled (George, 2014). The β value is also called scale parameter which determines the time at which 63.2% of the units fail. Based on the value of β, the distribution would assume a shape.
Bearing: As the value of β for bearing in the current scenario is less than 1, it implies that there are initial failures of bearings mainly due to poor control over quality, risk management, operating procedures and internal material used in bearing (Warwick , 2004). As the data suggest that bearings are actually going through the infant mortality during the burn in period but the rate of failure is reducing, those bearings surviving this period could be used with appropriate maintenance procedure

Eta Value
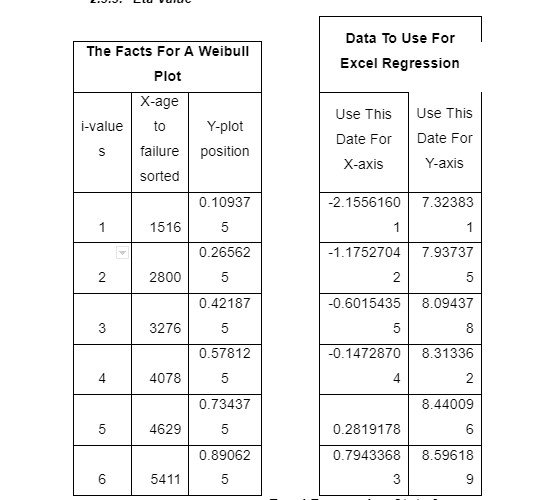
Eta value is a scale factor such that when it decreases, the height of the PDF distribution increases with decrease in width and when it increases, the vice versa happens (Lee, 2014).

Dig deeper into Potential incorporation of the Helispares business with our selection of articles.
References
Aboelmaged, M. (2010). Six Sigma quality: A structured review and implications for future research. International Journal of Quality & Reliability Management, 268-399.
Cudney, A., & Furterer, L. (2012). Design for six sigma in product and service development: Application and case studies. Boca Raton: CRC Press.
Desai, N., & Shrivastava, L. (2008). Six Sigma - A new direction to quality and productivity management. (pp. 19-25). San Francisco: World Congress on Engineering and Computer Science.
Fung, K. (2015). Design for Six Sigma (DFSS): Introduction. Hong Kong: Hong Kong Society for Quality.
Fursule, V., Bansod, V., & Fursule, N. (2012). Understanding the benefits and limitations of six sigma methodology. International Journal of Scientific and Research Publications, 2(1
General Electric. (2014). The roadmap to customer impact. New York: GE. Liu, Y., & Li, K. (2013). Application of six sigma methodology DMAIC in HR project management-A case study of Motorola SC HR DSS project. Routledge.
Marksberry, & Philip. (2011). Relevance of ecommerce and the potential benefits to SMEs. International Journal of Lean Six Sigma, 2(2), 132-150.
Murby, L., & Gould, S. (2005). Effective performance management with the balanced scorecard technical report. CIMA. Retrieved April 23, 2015
Rall, K., & Milosavljević, P. (2005). Six Sigma concept in the maintenance process of technical systems. Mechanical Engineering, 3(1), 93-108
Six Sigma Academy. (2006). Role of design for Six Sigma in total product development. Six Sigma Academy International.
Warwick Manufacturing Group. (2012). Quality function deployment. Coventry: WMG.
Weibull. (2017). Life data analysis (Weibull Analysis). Retrieved February 23, 2017, from Weibull.com: https://www.weibull.com/basics/lifedata.htm
- 24/7 Customer Support
- 100% Customer Satisfaction
- No Privacy Violation
- Quick Services
- Subject Experts


