Comprehensive Study Based on World Bank Data (1996-2015)
Introduction
For the analysis of the different variables, the report has selected the 10 countries from Asia which is critical for business dissertation help. The major data was collected from the World Bank related to population, GNI, per capita, inflation, exports of goods and services, Import of goods and services and CO2 emission. For the analysis data of countries related to the variables was collected from 1996-2015. Following are the definition of selected variables:
Population: The term population refers to count of all residents regardless of legal status or citizenship.

GNI per capita: This refers to Gross National Income (GNI) which is sum of value added by all residents producers plus and product taxes that is not including the valuation of output plus net receipts of primary income from abroad. It is calculated in national currency and converted to US dollars at official exchange rate for comparison across economics.
Inflation: This measured by the consumer price index reflects the annual percentage change in the cost to the average consumer of acquiring a basket of goods and services that may be fixed or vary at specific interval.
Exports of goods and services: It represents the value of all goods and services offered to rest of the world. This include value of merchandise, freight, insurance, transport, travel, royalties, license fees, and other services, such as communication, construction, financial, information, business, personal, and government services. They exclude compensation of employees and investment income and transfer payments.
Import of goods and services: Imports of goods and services represent the value of all goods and other market services received from the rest of the world. They include the value of merchandise, freight, insurance, transport, travel, royalties, license fees, and other services, such as communication, construction, financial, information, business, personal, and government services. They exclude compensation of employees and investment income and transfer payments.
CO2 emission: Carbon dioxide emissions are those stemming from the burning of fossil fuels and the manufacture of cement. They include carbon dioxide produced during consumption of solid, liquid, and gas fuels and gas flaring.
Countries for analysis
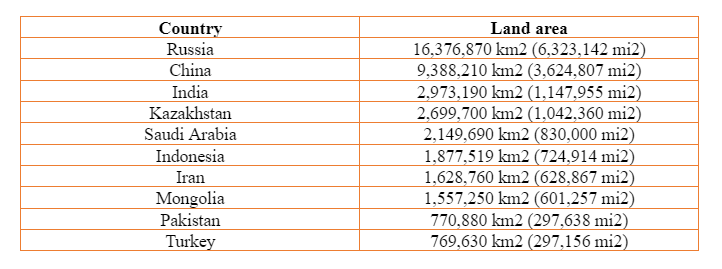
For the analysis, there are 10 countries selected from Asia considering the largest land areas acquired. With a total land area of 31,105,763 km2 (12,009,997 mi2), Asia is far and away the largest continent on Earth. Asia features a wide range of biomes and climates, from the frigid tundra of Siberia in Russia to the deserts of Saudi Arabia to the equatorial jungles of Indonesia (Land areas of Asian countries, 2022). Following are the 10 major countries that were selected for current analysis of given variables:
Statistical method
For the analysis, descriptive method is used for analyzing the data of the countries focusing on the variables. For the representation graphical method is used. This has helped to identify the mean of the variables and provides the information related to the improvement and decline.
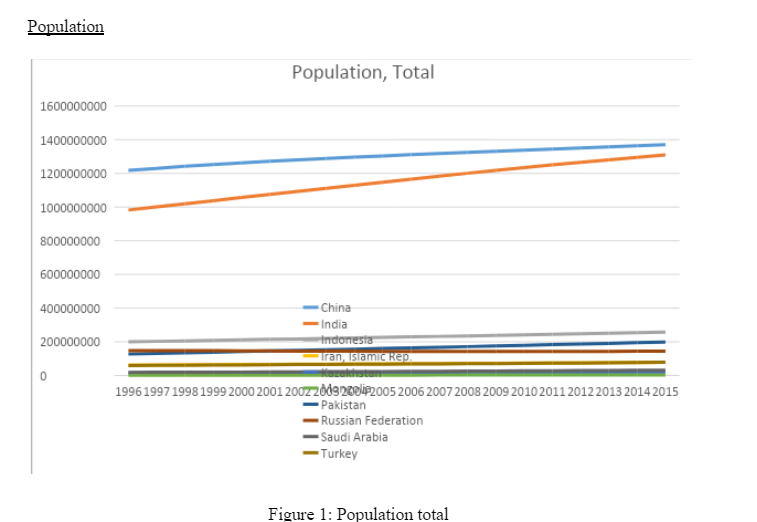
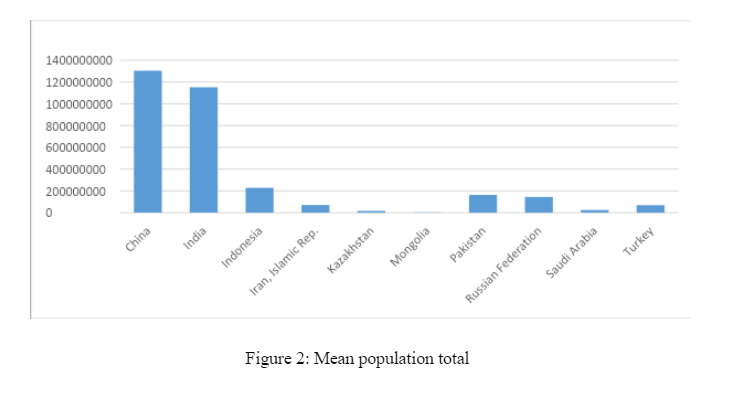
The graph has provided the information related to growth in population of selected countries from the year 1996 to 2015. According to analysis, population of all countries are increased between these periods of time but the significant improvements are noticed for China and India.
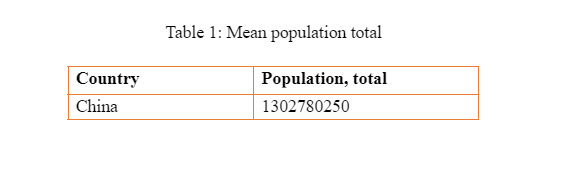
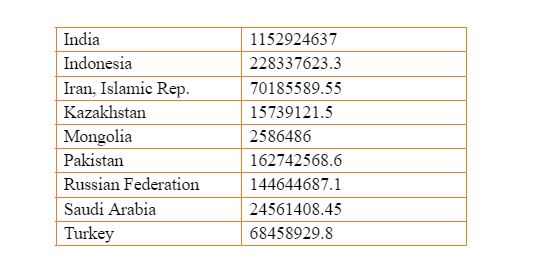
Table 1 has provided the information related to the mean of population of selected countries. According to analysis, mean of population was highest in China 1302780250 total followed by India 1152924637 total and lowest in Mongolia 2586486 total.
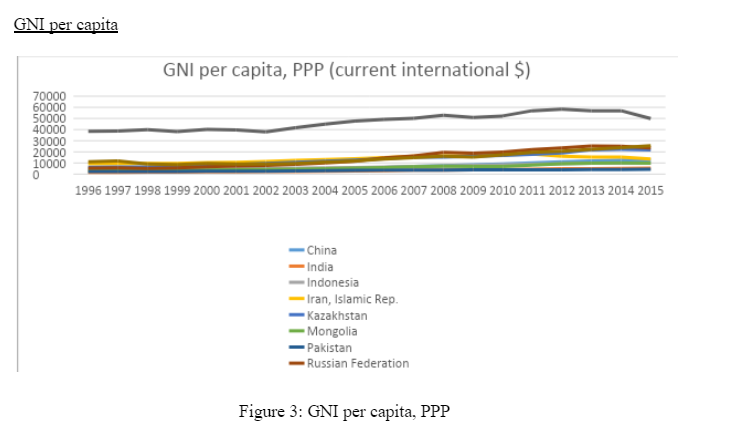
The graph has provided the information related to growth and decline in GNI of selected nations. According to analysis, the GNI of Saudi Arabia was strong as it was growing well in past years and highest among the other Asian countries.
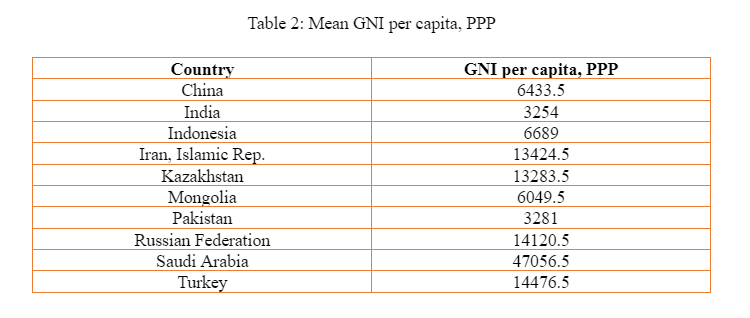
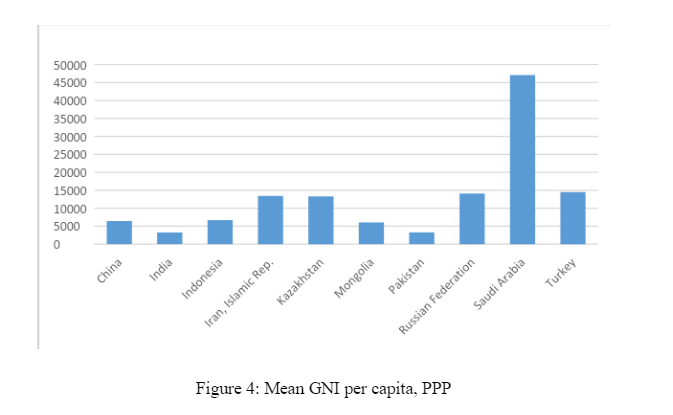
According to analysis of table 2, it has been carried out that mean GNI of Saudi Arabia was highest among the Asian countries 47056.5 per capita, PPP followed by Russia 14120.5. Moreover, the lowest GNI was identified for India 3254 per capita, PPP.
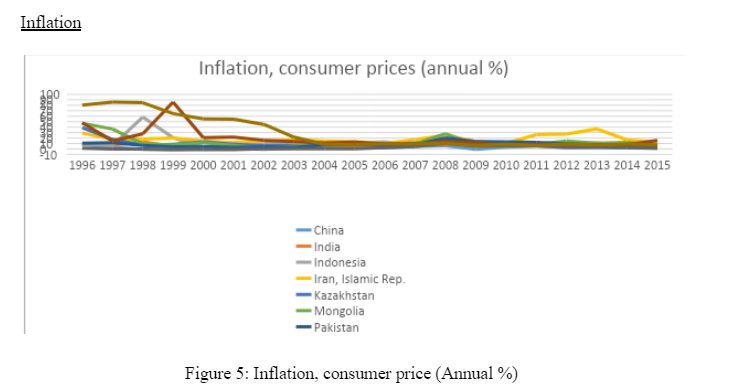
The graph has provided analysis of inflation among the Asian countries for the selected period of time and it has been identified that Turkey has highest level of inflation followed by the Iran and Russia. The lowest rate of inflation was identified for Saudi Arabia.
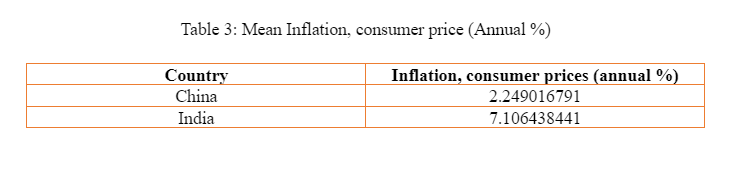
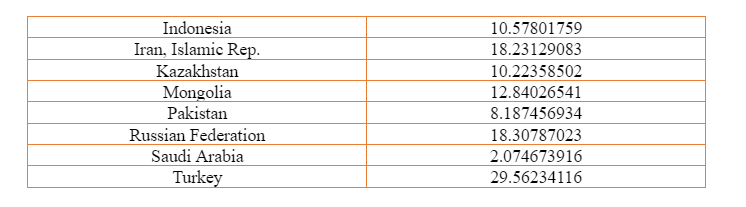
According to table 3 it has been considered the mean value of inflation was highest for Turkey 29.56 consumer price (annual %) and followed by Russian 18.30 consumer price (annual %). The lowest mean inflation was identified for Saudi Arabia 2.07 consumer price (annual %).

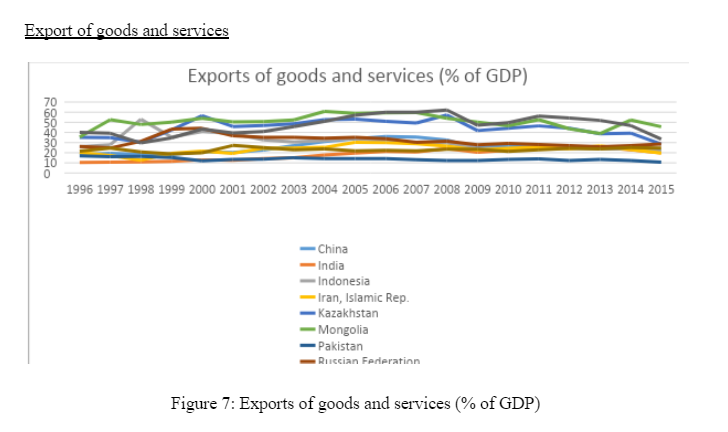
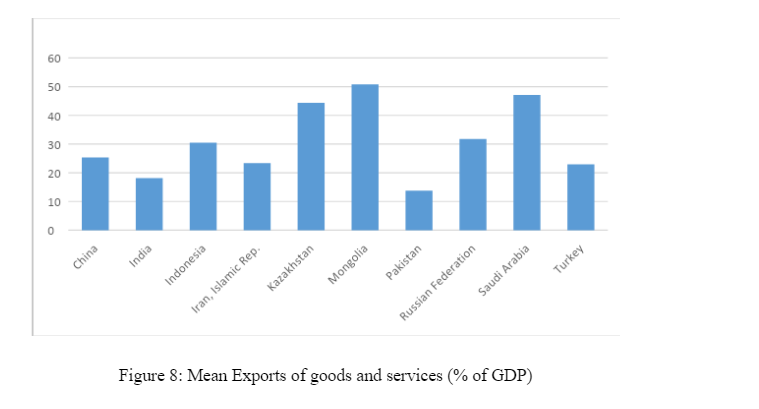
According to graphical analysis, it has been carried out that export of goods and services was highest for Mongolia and followed by Russia. However, the lowest level of export was identified for Pakistan.
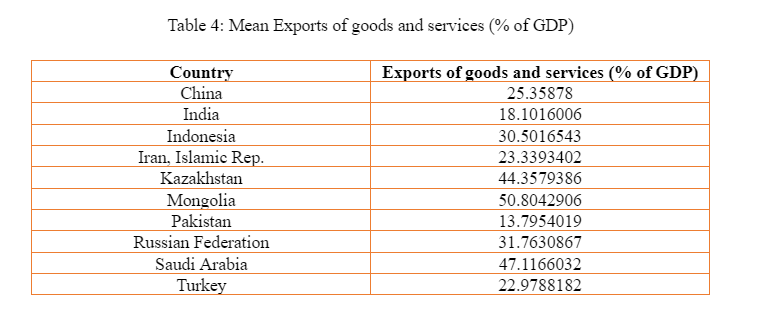
According to table 4, the mean export of Asian nations was analyzed and it has been carried out that Mongolia was having highest exports 50.80 (% of GDP) followed by Saudi Arabia 47.11 (% of GDP). The lowest mean of export was identified for Pakistan 13.79 (% of GDP). The export plays a critical role in development and growth of the GDP of nations at government collect foreign currency that increase the value of exchange. Here, the GDP of China was so high compare to other Asian nations, therefore the comparative analysis shows less mean value of China and higher for Mongolia as their GDP is low compared to others.
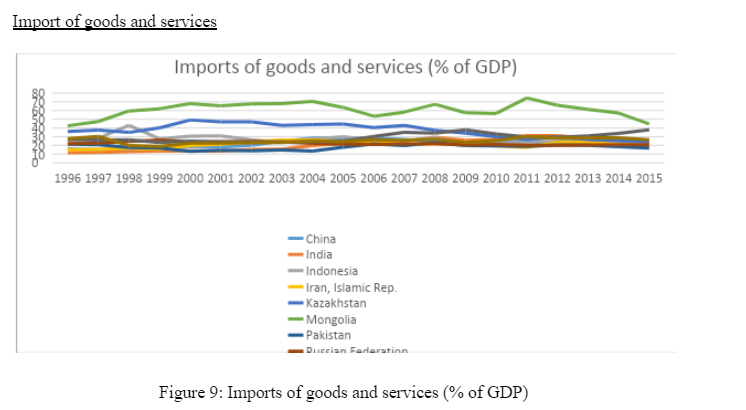
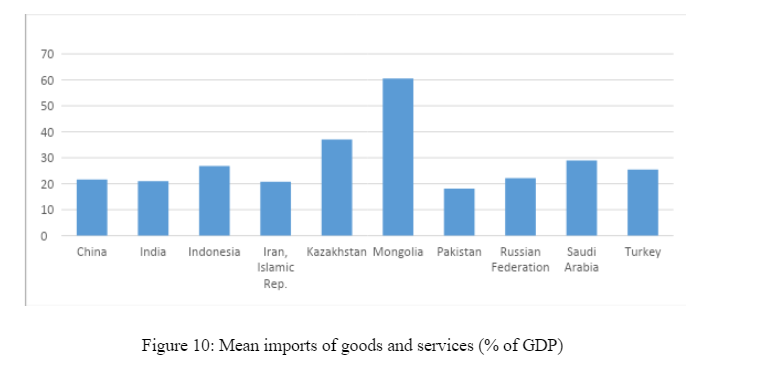
As per the analysis, the rate of import was highest for Mongolia followed by the Kazakhstan considering the % of GDP. Moreover, the lowest rate of import was identified for Pakistan.
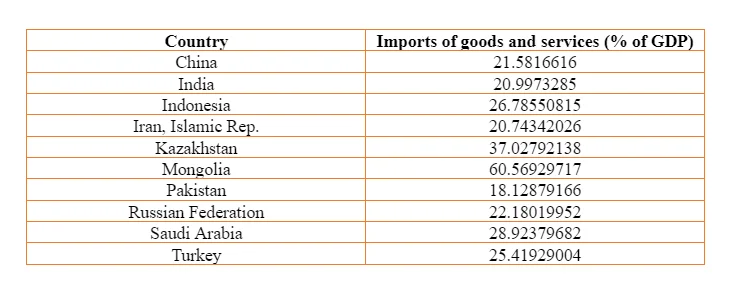
According to analysis of table 5, the mean value of import was highest for Magnolia 60.56 (% of GDP) that followed by Kazakhstan 37.02 (% of GDP). As per the analysis of the import level of countries, the lowest import of goods and services was identified for Pakistan 18.12 (% of GDP). The level of import shows that internal economy and manufacturing of country as they are producing all types for goods and services considering the needs of the population and able to satisfy by not taking the help of other nations. However, this calculation is done considering the level of GDP of country there for % of import varies accordingly.
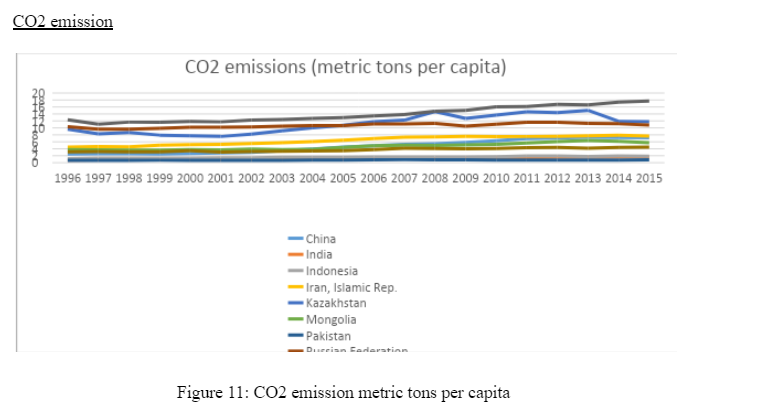
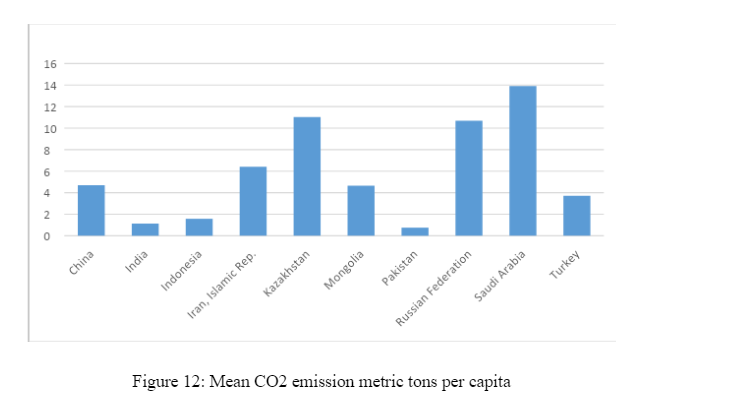
According to graphical representation, the level of CO2 emission is major problem not only for Asian countries but also for the world. As per the analysis of top 10 Asian nations by land area, the level of CO2 emission was highest for Saudi Arabia followed by the Kazakhstan. The lowest level of CO2 emission was identified for Pakistan.
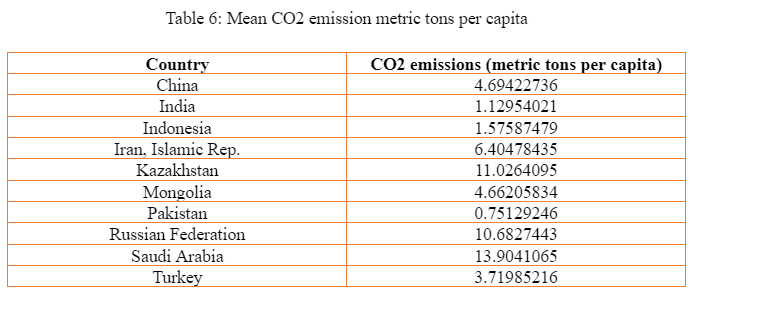
From table 6, the mean value of CO2 emission was highest for Saudi Arabia 13.90 metric tons per capita that followed by Kazakhstan 10.68 metric tons per capita. The lowest mean value for CO2 emission was 0.75 metric tons per capita identified for Pakistan.
Discussion
The study has analyzed the various variables for analysing the effectiveness and weakness of nations using the World Bank database from 1996 to 2015. The current analysis was done focusing on 10 biggest Asian nations by land area. According to outcome of the analysis, the population of all countries are increased between these periods of time but the significant improvements are noticed for China and India. According to analysis, mean of population was highest in China 1302780250 total followed by India 1152924637 total and lowest in Mongolia 2586486 total.
According to analysis, it has been carried out that mean GNI of Saudi Arabia was highest among the Asian countries 47056.5 per capita, PPP followed by Russia 14120.5. Moreover, the lowest GNI was identified for India 3254 per capita, PPP. Moreover, the mean value of inflation was highest for Turkey 29.56 consumer price (annual %) and followed by Russian 18.30 consumer price (annual %). The lowest mean inflation was identified for Saudi Arabia 2.07 consumer price (annual %).

According to analysis, the mean export of Asian nations was analyzed and it has been carried out that Mongolia was having highest exports 50.80 (% of GDP) followed by Saudi Arabia 47.11 (% of GDP). The lowest mean of export was identified for Pakistan 13.79 (% of GDP). Apart from this, the mean value of import was highest for Magnolia 60.56 (% of GDP) that followed by Kazakhstan 37.02 (% of GDP). As per the analysis of the import level of countries, the lowest import of goods and services was identified for Pakistan 18.12 (% of GDP). The level of import shows that internal economy and manufacturing of country as they are producing all types for goods and services considering the needs of the population and able to satisfy by not taking the help of other nations. Moreover, the mean value of CO2 emission was highest for Saudi Arabia 13.90 metric tons per capita that followed by Kazakhstan 10.68 metric tons per capita. The lowest mean value for CO2 emission was 0.75 metric tons per capita identified for Pakistan.
Conclusion
From the analysis, it has been carried out that mean value of variables like population, GNI, per capita, inflation, exports of goods and services, Import of goods and services and CO2 emission is varying across the period from 1996 to 2015 for 10 biggest countries of Asia by land area. There is significant improvement and decline was observed during the period of time for analysis considering the data provided by the World Bank.
References
Foster, S.J., Kuo, T.C., Wan, A.K.Y. and Vincent, A.C., 2019. Global seahorse trade defies export bans under CITES action and national legislation. Marine Policy, 103, pp.33-41.
Holland, J.H., 2018. The global economy as an adaptive process. In The economy as an evolving complex system (pp. 117-124). CRC Press.
Sultanuzzaman, M.R., Fan, H., Mohamued, E.A., Hossain, M.I. and Islam, M.A., 2019. Effects of export and technology on economic growth: Selected emerging Asian economies. Economic research-Ekonomska istraživanja, 32(1), pp.2515-2531.
World Bank, 2020. Global economic prospects, June 2020. The World Bank.
Online
Land areas of Asian countries, 2022 [Accessed through] < https://worldpopulationreview.com/country-rankings/largest-countries-in-asia > [Accessed on 27 November 2022]
Looking for further insights on Comprehensive Overview of the TIC Project? Click here.


- 24/7 Customer Support
- 100% Customer Satisfaction
- No Privacy Violation
- Quick Services
- Subject Experts