Butterfly Biodiversity Question (Data Analysis and Interpretation)
- 05 Pages
- Published On: 09-10-2023
Introduction
Biodiversity is a measure of the numbers of species that make up a biologic community and is considered to be one of the more important aspects of community organization and structure. The factors contributing to differences in the levels of diversity between communities are not fully understood and remain a topic of scientific debate. Many researchers seek biology dissertation help to explore these complexities and contribute to the ongoing discussions in the field.
The purpose of this coursework is to present you with some real data which you should analyse and interpret to the best of your ability. The aim is to identify whether butterfly biodiversity has changed in the Monks Wood site during a period of over 40 years. A number of resources are available, including Excel (for graphically presenting data), SPSS (or equivalent statistical packages for data analysis) and a program called ‘PAST’ (can be downloaded from the internet or see Dr. Routledge) which has a number of useful features (including Diversity Statistics), all of which could be utilised with a little practice and effort.

Objectives
The main objective of this assignment is to get you thinking about biodiversity and how we measure it, and the challenges we face when trying to make sense of real ecological data. There are a number of ways in which the data could be analysed and interpreted, for instance using some common indicators of biodiversity (including species diversity and evenness). Details of how to calculate these are given below (see ‘Procedure’). Alternatively, you can use software like ‘PAST’ to do this for you. To get you started on the right track, we would suggest that you:
- Calculate total number of individuals, total number of species, species diversity and species evenness for butterfly species data collected each year in Monks Wood.
- Evaluate whether time-related patterns (similarities or differences) are detectable in these data.
Materials
- A practice datasheet listing species and their abundances more than 40 years is available to download from Blackboard Learn.
- Students can use a statistical program, called ‘PAST’, to help calculate several diversity and evenness indices. The program is simple to use and also permits the statistical comparison of values calculated for single locations at different times or values for two or more geographic locations. One can determine whether or not two diversity values are really different, statistically. The program, a user’s guide, sample data sets, and sample statistical analyses can be downloaded, without cost, at the following URL: http://folk.uio.no/ohammer/past/
- Students may also decide to use other statistical software, such as SPSS, which can be accessed via Brunel’s Central Software (intranet).
Looking for further insights on Butterfly Biodiversity Assignment Sample? Click here.
Procedure
- These terms are used by biologists (ecologists) to describe the abundance of species and individuals within an area (or environment):
- Species Diversity (S) the number of species in the sample (e.g. number of bird species).
- Species Evenness (or equitability) - a measure of the number of individuals within species populations. Evenness is greatest when species are equally abundant.
Here is a sample data set:

Numerical indices are often calculated to quantitatively describe different levels of diversity and evenness in samples collected from different areas, environments, or at different times from the same environment. One example might involve an evaluation of possible biologic changes caused by modifying the environment – our interest in this exercise.
Two commonly calculated indices are:
- Shannon-Weaver Information Function – combines the number of species present and evenness into a single index: D = -Σ pi ln pi i = an index number for each species present in a sample. pi = ni/N = the number of individuals within a species (ni) divided by the total number of individuals (N) present in the entire sample. ln = natural log. This means that you multiply the proportion (pi) of each species in the sample by the natural log of that same value (ln pi), then add (Σ) the values for each species, and finally multiply by minus 1 (see example below).
Let’s use our sample data (5 species, 21 total individuals) and calculate D :
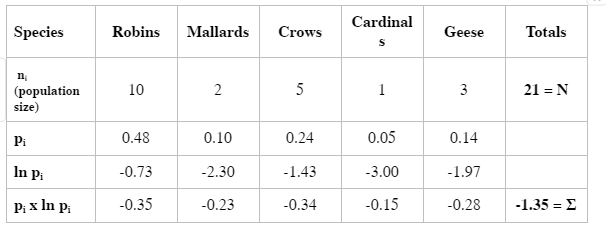
S = 5 species; N = 21 individuals; D = -Σ pi ln pi =-1 x -1.35 = 1.35
Remember: The value of D is highest when species are equally abundant.
- Species Evenness –separates the effect of different population sizes (numbers of individuals within species) from simple species diversity (number of species):
E = eD/s; Details: e = 2.7 (= constant), D = the value of the Shannon-Weaver Information Function, and s = number of species in sample (= simple species diversity).
For our example: E = eD/s = 2.71.35/5 = 3.82/5 = 0.764
NB: Use the ‘Xy’ key on the calculator when you calculate Species Evenness
- Using a calculator, a spreadsheet program, or PAST (click on the link and, when prompted, select Open if you're using a network PC or Save if you'd like to have a copy on your own PC), calculate the Shannon-Weaver Information Function, Species Evenness, Species Dominance, total abundance, species Richness for each census date. Compare the values for each, paying particular attention to the distribution of individuals among species. If you decide to use PAST to perform diversity and evenness calculations, you can also compare pairs of diversity values for statistical significance. Enter diversity data in columns, select columns by clicking on the header of the first & then holding down the shift key and selecting the second. Select Diversity indices from the Diversity Menu and the basic diversity and evenness calculations will be made. Use ‘Compare diversities’ to determine whether a range of indices are statistically different using two different randomisation procedures (this approach is much more accurate when the data are not normally distributed).
Reporting
All word processing should be font size 12 with 1.5 line spacing and default page margins (2.5cm top and bottom, and 3.17cm left and right). Please adhere to within 10% of the word limits set.
Front Page
Please provide your student ID number, date of submission, module number (IE5601) and the assignment title (Assessment of Butterfly biodiversity in Monks Wood).

Introduction (Approx. 500 words)
Write a short introduction about biodiversity; what it means, why it is important, the factors affecting biodiversity, whether there is evidence that human activities are affecting biodiversity and the merit of producing wild life sanctuaries within large urban developments. Make sure you state the AIMS of this report.
Materials and Methods
Detail the approaches you took to analyse the data, the indices calculated and measured (and what they mean), and the statistical methods applied.
Results
Present not more than 8 carefully designed figures (for instance six graphs and two tables, or four graphs and four tables, or equivalent) with appropriate detailed legends to help illustrate key messages within the data. The results section should describe what the data show. Do not be tempted to discuss your findings here - this comes later (in the Discussion).
Discussion (Approx. 1000 words)
Evaluate and describe your results within the context of what is known about Biodiversity. For instance, you could discuss whether (a) you would expect to see significant changes in butterfly biodiversity over the time scale of the study, (b) whether you believe the survey was adequate to address the question as to whether changes in butterfly biodiversity has occurred and (c) what factors might explain any changes in the abundance of butterflies that you have identified over time? These are just some suggestions for further thought, and there are many other messages that could be extracted from this data set that warrant further discussion. Continue your exploration of Butterfly Biodiversity Assignment Sample with our related content.
References
Provide a complete list of reference material, and ensure that all references are referred to in the text.
Submission
Coursework must be submitted electronically through Blackboard learn and will be checked for originality using Turnitin (plagiarism detecting software).


- 24/7 Customer Support
- 100% Customer Satisfaction
- No Privacy Violation
- Quick Services
- Subject Experts