Exchange Rates and Consumer Price Index
Introduction
This is a report based on a very prominent econometrics theory, and this theory revolves around the exchange rate and the consumer price index, as it is termed as the Purchasing power parity.
The theory states that the exchange rate between the two observed currencies is in equilibrium with the power of purchasing for each country and comparing it, this not only illustrates that the potential application of rate of exchange, but also illustrates the corresponding relationship between these relational variables with CPI or Consumer Price Index of the respective countries. For students who are willing to learn about the complexities of economics, seeking economics dissertation help can provide good and needed insights into understanding such concepts.
This illustrates that the level of a specific commodity is fixed in terms of that currency. And if they are compared in the equivalent currency then the results would be the same (Nakorji Agboegbulem, Gaiya & Atoi, 2021). There are two types of purchasing power parity, one is fixed, which illustrates the exact relationship between the prices and the exchange rate, while the other is relative, which is in comparison to the previous states, this can be compared.
In essence it can be said that this study would study the relative part (Yun, 2017). The relative part illustrates that the that the rate of change in the exchange rate that is caused by the appreciation or depreciation of a particular currency, is similar in correspondence to the comparative analysis of their inflation or increase in prices. This, thus, deduces, whether this is true in terms of analysis.

The Countries that are selected for the sake of this research report are USA and Japan. The exchange rate and the Consumer Price Index, both would be studied and compared. A point to note here, is that the consumer price index that is studied at this point is based on the overall price index, that is also a proxy for inflation.
In real life, it can be said that there are numerous factors that determine the exchange rate, or the consumer price index, so, it is not evident, or necessary that the price index or the exchange rate are predicted, but this is not the sole comparison here, though there are models that would compare whether one of the two, Consumer Price Index or Exchange rate, are affecting the other, or not.
The key testing here would be whether the two different rates of change are statistically same or different that one another, or not. This would be studied and elaborated in terms of the overall variation and the difference in variation in the two models. Additionally, it can be observed that the factors that account for the most variation is determined are numerous, and cannot be encompassed in small research.
Research Hypothesis
There are three basic hypothesis that needs to be tested, these are divided into three parts. These parts would have their own pairs of hypotheses, including the null and alternates.
Rate of Changes are Same
H10: There is no true mean difference between the rate of change of the exchange rate and the rate of change of Comparative Consumer Price Index.
H1a: There is a true mean difference between the rate of change of the exchange rate and the rate of change of Comparative Consumer Price Index.
This hypothesis indicates that the true mean difference of both Consumer Price Index and the Exchange rate are the same. In order to provide and prove Purchasing Power Parity, the null hypothesis should be proved correct.
Growth of Exchange Rate impacts Growth in Consumer Price Index
H20: The Growth rate of Exchange does not impact the growth rate of Consumer Price Index.
H2a: The Growth rate of Exchange does impact the growth rate of Consumer Price Index.
This is an impacting hypothesis, and it tends to illustrate whether the exchange growth rate impacts the Consumer Price Index Growth Rate. Here, if one wants to indicate that there are other factors that impact more, then the null hypothesis should be proven correct.
Growth of Consumer Price Index impacts Growth in Exchange Rate
H30: The Consumer Price Index does not impact the growth rate of Growth rate of Exchange.
H3a: The Consumer Price Index does impact the growth rate of Growth rate of Exchange.
This is an impacting hypothesis, and it tends to illustrate whether the Consumer Price Index Growth Rate impacts the exchange growth rate. Here, if one wants to indicate that there are other factors that impact more, then the null hypothesis should be proven correct.
Data Presentation
Data in this dataset is presented in terms of monthly records, and it is taken from three different sources, the exchange rate was acquired from (DEXJPUS), whereas the CPI of Japan was acquired from (FPCPITOTLZGJPN), and the CPI of USA was acquired from (FPCPITOTLZGUSA). In essence it can be observed that these are all time series, though they are not seasonally adjusted, but they tend to be following similar format. So, in order to combine these, the reference column of date was used, and there were three other columns that were used. Initially, the potential variants had similar dates and illustrated similar trends.
Methodology
In observation of the dataset, there were numerous methods that were applied, these are listed and explained below:
Data Preprocessing
In this part, the preprocessing is done, and the preprocessing that is applied here is basically divided into three phases, the first phase is removal of the nulls, the second phase is creation of a CPI exchange variable, and the third phase is creation of returns of both CPI exchange and Foreign Exchange returns. The CPI exchange returns indicate that the same order as the exchange rate, meaning JPY per USD. In other words, USD is the denominator and JPY is the numerator. After the calculation of CPI exchange, the calculation of log returns is done, and this is to highlight the increase or decrease in the previous months. After the calculations are done, these are added to the main variable,
Paired T-Test
In order to address the first hypothesis, and evaluate whether in terms of pairs, there is a difference in the means, or the distribution is different from another. So, in evaluating that Paired T-test is performed, to do a one-on-one analysis of the differences between exchange rate growth and CPI exchange growth. This test would highlight where Purchasing power parity was correct.
Linear Regression
Linear Regression in terms of second and third hypothesis testing is elaborated, and in this elaboration, there are factors that are studied, in this, the impact of both the growth rates are evaluated and both the level of significance, and the R square metric performs the best available potential variance and illustrates whether any one of them is able to predict the other.
Results
Summarization
After the preprocessing was completed the following is the summarization of all 7 variables, and illustrates all the descriptive statistics that are possible.


This illustrates that there is no missing values, and the CPI of Japanese has the mean of 89.9, while that of USA is 64.75, indicating that Japan has a higher inflation rate. Additionally, Japanese fluctuates between 32 and 102, whereas USA has a larger fluctuation in terms of 16 to 115. The exchange rate is between 76 and 357 with a mean of 157. Thus, it can be said that the CPI exchange is between 0.87 and 2.51. So, this is the reason why growth rate and relative PPP is tested, the logistic regression has a mean of -0.0019 is for exchange rate and the mean for logistic regression for CPI returns is -0.0013. Thus, it is comparable.
Paired T Test
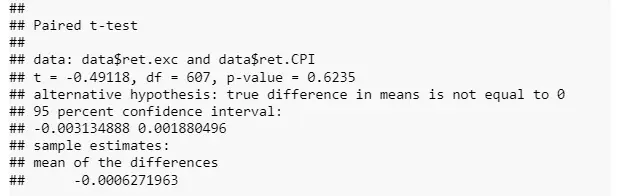
In accordance with the first hypothesis, it can be observed that the means do seem apart by a fraction, but the t stats being 0.49 and P value being 0.62 indicates that null hypothesis is accepted, indicating that the series of Pricing and Exchange Growth are the same, and thus in accordance with the Purchasing Power Parity.
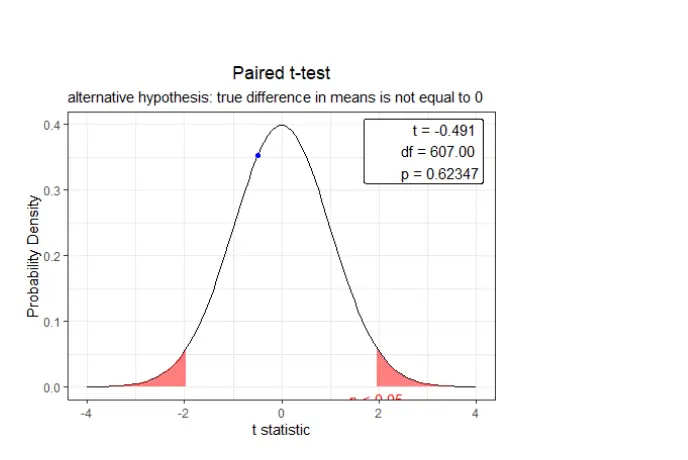
This indicates that the t stats is well within the acceptance region, and therefore not in the red zone, indicating that null hypothesis cannot be denied.
Linear Regressions
There are two Linear Regressions, each of them shifting the dependent and independent variables. These are given as follows:
Model 1
In this model, the independent variable is exchange rate returns, and the dependent variable is CPI Exchange Returns.


This model indicates that the model is insignificant, and it also leads to the potential rejection of the overall sense. Additionally, it can be said that the p value and t statistics indicate that the null hypothesis be accepted, and therefore, there is possibly no relationship between the two, this is also illustrated by the low R square and negative Adjusted R square, making it the clear, that there are other factors that should be included in the model.
Model 2
This is the model that is completely in reverse to the first model, and it illustrates that the dependent variable should be the exchange rate whereas the independent variable should be CPI exchange returns. The results are as follows:
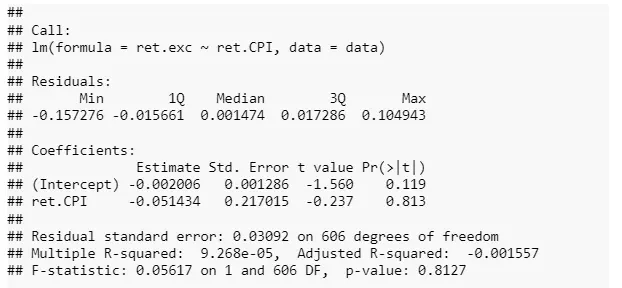
These results are quite similar, and it does indicate that Exchange rate returns are not to be predicted by CPI returns. It also indicates that the results should lead to the acceptance of the null hypothesis, and it is also proven by the R square and adjusted R square values. Moreover, this leads to the results that there are other factors that should be considered.

Conclusion
It can be concluded that all the three hypotheses have their null hypothesis accepted, indicating all the points of PPP. As it can be seen that the first point that PPP makes is that there is no difference between the exchange rates and the prices, and that is proven by the first hypothesis, the second and third also indicate important parts of PPP, and those are the factors that these cannot be solely determined, and other factors such as the news are also responsible as well. So, in essence of observing Japan and USA it can be said that CPI and Foreign Exchange Rate do support Purchasing Power Parity. Additionally, the time period of 1971 to present collectively supports this theory.
Take a deeper dive into Ethical Requirements in Economics with our additional resources.
References
Board of Governors of the Federal Reserve System (US), Japan / U.S. Foreign Exchange Rate [DEXJPUS], retrieved from FRED, Federal Reserve Bank of St. Louis; https://fred.stlouisfed.org/series/DEXJPUS, October 30, 2021.
World Bank, Inflation, consumer prices for Japan [FPCPITOTLZGJPN], retrieved from FRED, Federal Reserve Bank of St. Louis; https://fred.stlouisfed.org/series/FPCPITOTLZGJPN, October 30, 2021.
World Bank, Inflation, consumer prices for the United States [FPCPITOTLZGUSA], retrieved from FRED, Federal Reserve Bank of St. Louis; https://fred.stlouisfed.org/series/FPCPITOTLZGUSA, October 30, 2021.
Nakorji, M., Agboegbulem, N. T., Gaiya, B. A., & Atoi, N. V. (2021). Purchasing power parity approach to exchange rate misalignment in Nigeria. CBN Journal of Applied Statistics, 12(1), 45-75.
Yun, T. (2017). Natural Exchange Rate and Its Implications for the Purchasing Power Parity Puzzle. Emerging Markets Finance and Trade, 53(11), 2397-2418.


- 24/7 Customer Support
- 100% Customer Satisfaction
- No Privacy Violation
- Quick Services
- Subject Experts