Financial Signals and Market Efficiency
Abstract
The concerned description laid focus on recognizing the crucial financial signals or ratios playing a vital part which determines the securities rates. In addition, the rapid changing of the securities prices on the base of past results of the organizations will assist us in understanding the relevance of market hypothesis being efficient in this financial market. It is within the range of this discussion to enquire about the market efficiency form. It will be helping those willing to invest in securities following minute fundamental and technical analysis even if there is existence of volatility. For students who are seeking expertise in economics dissertation help, understanding all these dynamics is critical for navigating the complexities of financial markets efficiently.
Introduction

The analysis of price movements of the past for the requirement of forecasting of price movements in the future is referred to as technical analysis. Technical analysis is applicable on currencies, indices, commodities, stocks or other securities wherein the values are influenced by demand and supply.
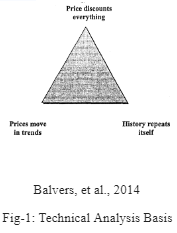
The above diagram shows the three points on which technical analysis is based upon; 1.Price discounts everything 2.Prices move in trends and 3.History repeats itself
The screenshot below shows the difference between technical approach and fundamental approach used in forecasting future price direction. (Balvers, et al., 2014)
The idea of efficient market hypothesis is there since long time and the decision to invest by financial community is dependent on it. As per the concept of efficient market hypothesis, all the available information is being fully reflected in the securities prices and at the same time it is impossible to tell in advance what will be their returns in future depending on past financial data and stock performances. The three different categories of efficient markets are 1.Strong form efficient markets, 2.Semi strong form efficient markets and 3.Weak form efficient markets. (Campbell, et al., 2014)
Strong form efficient markets contain all insider news which is generally difficult to gather, semi strong form contains each and every analysis based on the company’s financial details, announcement of dividends, announcements of primary or introductory public offerings etc., whereas weak form efficient displays each and every information that are available in the public domain. Before one can apply any test it has to be determined to which segment the market belongs to at that moment. Many researchers claim that future stock returns are predictable with the help of technical or fundamental analysis calculated through the rational investors present and has the required fundamental information for making such analysis, thereby executing the part of the dealers in financial markets. However, as per EMH, what will be the returns on securities depend on company performance and management decision and can not merely be predicted based on the information available from the past data. (Fama, 2011)
Literature Review
As per EMH, securities prices do show each and every information that are available which makes mean historical returns not profitable for the trades done while it is efficient market scenario. The returns based on the trading plans with the utilization of watchable trends that the stocks have in their historical prices are inferior for buying and holding strategies for long term. The profits whether are accounted on the pattern of buying and holding strategy pattern or by the strategies with patterns that are observable basically relies on the accuracy of the share market. The concerned phenomenon has been noticed in London stock market since the foreign investors are higher in number there and the market being more efficient. (Guerrien, Gun, 2011).
The major emphasis on EMH is because of the attention paid to the opinion of academics. However, in actual, the gains in share markets contain predictable properties that very often negate strategy of weak form efficient market. As per Jarrett, in emerging markets, there is no existence of weak form of efficiency generally since the gains are very much calculated. Hence the intention of the share market to be strongly efficient is very hard. Even in a few developed markets, the importance of insider trading exists since these people can for sure surprise the share and foreign exchange market. Predictors generally attempt to forecast the nature of the stock market. While they do that, in the long run, the stability does not exist in the data. This happens more if the prediction is done by huge number of traders and in the process it becomes more complicated for testing which form of market efficiency is applicable and consequently which forecasting technique to approach for success. The innovators are likely to have some profit but it may not last long once it gets started to be followed by most of the traders. Hence, as time passes the gains will be instilled in the share prices. As a result there will be formation of various methods of financial forecasting. The actual research conducted on the efficiency of the market is segmented into two parts. The first is to calculate the gains from the noticeable return patterns from the past. Secondly, by the way of fundamental analysis that mentions that others conditions are also there and equally important for determining the future values. It might also happen, that share prices are not assessed by the available information as forecasted since information is interpreted in different ways by different investors. Hence, there might be situations when the prices of shares will progress in an unjustified fashion as compared to the available information. The gains of the shares when the market efficiency is in weak form, relies on the inclusion of past prices with the present prices as well as on the trader’s various interpretations regarding the information available. Our financial markets are more prudent and less foreseeable contrary to the notion of many earlier academic researchers. However, the beginning of the twenty first century marked the beginning of targeting of EMH by various economists and academicians. As per them, future stock prices are foreseeable based on the fundamental and technical analysis. The behaviour or sentiments of the traders also play an important role in determining the stock gains in the future. The share market pattern depends on interference of various types of traders. Some of the traders are very logical whereas the remaining tends to be noise traders and it is this mix which makes the total market volatile. Since the market has to be viewed as a complete structure, the information gets reflected in the share prices and as time passes by increased efficiency of the same can be expected based on more news gathered, concurrently decreasing the activities of professional associated with the market. Regarding the three presumptions of market efficiency, a new theory suggests that the analysis results of strong form and semi strong form of market efficiency remain similar. However, for the weak form of market efficiency the new theory is different as compared to the old theory. It confirms that share market gains can be calculated from the noted behaviour of the past share pricing. Most theories suggest that the future returns range from 3% for short term to 25% for long term investments. Opportunities of consumption differs due to volatility in output which results in more haphazard consumption design as confronted by the traders. Hence to make these patterns more smooth, traders modify the require % of gain on the shares. Because of this relation, gains on the shares are related to aggregate output. An efficient market is that where the prices fully reflect the information that is available at any given point of time. Even if the news is available then also market efficiency does not happen on its own. It is heavily dependent on the analytical and interpretational capabilities of the investors those were there in the market, taking into account that there is sufficient time for them and at the same time they are ready to broadcast the delicate information that can influence the share market gains. (Huber, Kirchler and Sutter, 2008). Take a deeper dive into The Role of Elites in Disaster Governance with our additional resources.
Methodology
To work on the efficient market hypothesis, the technical analysis of support and resistance should be taken into account.
When the demand is considered to be so strong enough that it prevents the price of a share from declining further, then it is told that the price of the share is at support level. Whenever the price of a share tends to move towards the support level, people are more interested in buying and those who are holding the share tend to lose interest in selling it and continue holding it. (Malkiel, 2012)
On the contrary, when the opposite happens, it is told that the share value is considered to be at resistance level. Here the supply is considered to be so strong that it prevents the price of the share to rise further. In this situation, those holding the share tend to sell it. (Balvers, et al., 2014)
Here, the dependent variable is the average closing share values and returns on amount invested, net margin of profit, earning value per share, debt/equity ratio and current ratio are the independent variable. Based on the independent variables mentioned above, a resulting equation has been formulated on the average closing share value. (Campbell, et al., 2014)
y= α+x1+x2+x3+x4+x5+ε
Where, y= Average closing share value (Dependent variable)
x1= Return on amount invested
x2= Net margin of profit
x3= Earning value per share
x4= Debt/equity ratio
x5= Current ratio
ε= Error term
Data Analysis and Data Interpretation
Let us now analyse the data and interpret the same as per the graphs below.

The above graph shows the price over one year period. The price rose from mid of May till end of August which fair share of decline periodically. However, it is getting resistance after reaching the peak. The price it trying to break the resistance level but tend to come down after it reaches near the level. One can also conclude that the volatility of the price is less at the moment at it is maintaining a gradual declining state till February of next calendar year.

Graph 2 shows that the value or price jumping up once it falls for some time. It is also of one year period. In the long run this value has the tendency to increase gradually. Though a resistance level has been marked in the graph, overall it is showing a gradual increase. However towards the end of the year it is showing decline but as per the graph it can be considered that once resistance level can act as support level, considering the overall graph view. (Wong, Manzur and Chew, 2012)
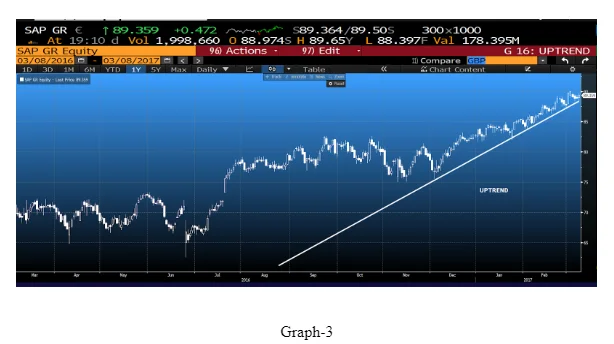
This graph is clearly showing uptrend over one year period. From March till June it was showing resistance of the value. That is more prominent in June where it witnessed a sharp fall. June can be considered volatile period because after falling it bounced back to almost the same level from where it fall. After that it continued to rise throughout the year gradually with periodical sharp falls and gradual bounce. However, it should be noted that whenever it gets resistance and witnesses a sharp fall, it is a signal that it will bounce back and move forward a bit more again.
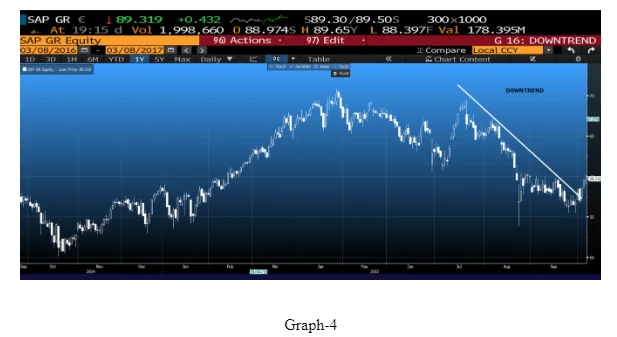
The graph 4 shows a clear downfall. However, this started after it got a resistance once at its apex value. On reaching the high price, it fell for some period and tried to break the resistance again. There was a sharp rise but the resistance was not cleared and it started a downfall which is pretty sharp. It we look at the starting of the graph, it is seen that there was a gradual increase of the price till the apex price. Though some sharp falls were witnessed still the value reached a high from the starting price in the graph. So, it can be analysed that the price will bounce back once it reaches the low level, unless any new market related news springs up. (Menkhoff, 2007) (Taylor and Allen, 2012)

Conclusion
Here it has been tried to analyse the effect of the information that is available in the public domain and how it influences the market value of the share based on technical analysis. Numerous information of financial importance can also be considered as independent variables so as to get to know the effect on the share values. Post Brexit, since we are concerned with weak form efficient markets, so focus was more on the information that was available in the public domain. Many tests can be carried out in the studies that are focused on strong form of efficient market and semi strong form of efficient market, like event study of semi strong market. Here it is also concluded that implication of EMH is stronger in emerging market when compared with sentimental or behavioural perspective of traders.
Reference
- Balvers, R.J., Cosimano, T.F. and McDonald, B., 2014. Predicting stock returns in an efficient market. The Journal of Finance, 45(4), pp.1109-1128
- Campbell, J.Y., Lo, A.W.C. and MacKinlay, A.C., 2014. The econometrics of financial markets. Princeton University Press
- Fama, E.F., 2011. Efficient capital markets: II. The journal of finance, 46(5), pp.1575-1617
- Guerrien, B. and Gun, O., 2011. Efficient Market Hypothesis: What are we talking about? real-world economics review, 56, pp.19-30
- Huber, J., Kirchler, M. and Sutter, M., 2008. Is more information always better?: Experimental financial markets with cumulative information. Journal of Economic Behavior & Organization, 65(1), pp.86-104
- Malkiel, B.G., 2012. The efficient market hypothesis and its critics. The Journal of Economic Perspectives, 17(1), pp.59-82
- Menkhoff, L., 2007. Examining the use of technical currency analysis. International Journal of Finance & Economics, 2(4), pp.307-318
- Taylor, M.P. and Allen, H., 2012. The use of technical analysis in the foreign exchange market. Journal of international Money and Finance, 11(3), pp.304-314
- Wong, W.K., Manzur, M. and Chew, B.K., 2012. How rewarding is technical analysis? Evidence from Singapore stock market. Applied Financial Economics, 13(7), pp.543-551


- 24/7 Customer Support
- 100% Customer Satisfaction
- No Privacy Violation
- Quick Services
- Subject Experts