Analyzing Social Media Usage: Descriptive Statistics
Task 1: Ungrouped Descriptive Statistics
1. Missing Values
With reference to Table 1 in the present case, the mean value of the survey, which has been carried out on social media users is 195. The value of the standard deviation is 62.42, and the coefficient of variation is 32%. The mean value is 195 minutes that show that majority of people spend 195 minutes on social media in a day. In this context, the value of the standard deviation is 62.42. However, the ratio of standard deviation is 32%, that shows that 32% of the sample is near to mean.
2. Compare the Mean and Median
The mean value of the survey is 195 minutes, and the median value is 150 minutes. The median provides a central value of the data set. In the context of the present case, the mean value is higher than the median value.
Task 2: Grouped Descriptive Statistics
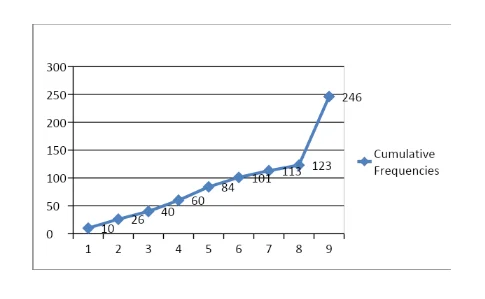
1. Construction of frequency table and outcomes of mean, SD and Coefficient of variation


2. Comparing results
The mean value ungrouped data under task 1 is higher than the mean value of the grouped data. The mean value of ungrouped data and grouped data is respectively195 and147.62. The value of standard deviations of ungrouped data and grouped data is respectively 62.42% and 62.97. Therefore, it can be stated that grouped data statistics are more accurate because the mean value is near to median value.
3.

Task 3: Relationships
1. Correlation matrix

2. ‘best’ predictor
As per the correlation matrix, there is a negative correlation identified between profit before tax, operating profit, and operating. In the context of the present case, the operating cost is being considered as the best predictor. The best predictor is also stated as a key influencer. In this present case, there is significant variation identified in the operating cost that leads to a significant impact on the profit before tax (Sprent, 2019). Therefore, operating costs would be acted the best predictor to determine the profit before tax in an appropriate manner.
3. Scatter graph for the plotting of pre-tax profit

4. Correlation of coefficient and coefficient of determination
In the context of the present case, there is a negative correlation identified between operating cost and profit before taxation. This is because the increment in the operating expenditure reduces the profit before tax. Therefore, the coefficient of correlation is -0.926. Similarly, the coefficient of determination (R2) is 0.860.
5. Regression Equation
As per the case, operating cost is being considered as an independent variable, and profit before tax is considered as the dependent variable. Therefore, a regression equation is formed with reference to the above chart:
Profit before Tax = - 0.063 (Operating cost) +1.275
Task 4: Networking
1.Network diagram

2. Critical path
As per the above diagram, there are two critical paths are identified:
A+C+E+F+H= 12 Weeks
B+E+F+H= 12 Weeks
3. Commenting on critical and non-critical activities
Critical activities have strictly defined start and finish times that could be identified as an important cause of project delay. The start time for non-critical activities can, to a certain extent, be freely selected (Zareei, 2018).

Task 5: Reflective report
1. I have applied different statistical measures and excel tools to evaluate the data and to generate appropriate solutions with reference to the requirement of different. Therefore, I think that I have appropriately completed the assignment with consideration of different tools of descriptive statistics.
2. In different tasks, I have found some challenging tasks such as interpretation of ‘best’ predictor through correlation matrix because the variable of profit before tax is negatively correlated with operating profit and operating revenue. Therefore, the selection of one best predictor has been identified as a challenging task for me. Moreover, I have found difficulties in the creation of the network diagram.
3. By considering the experience which has been gained from the current assignment, I would learn new statistical tools and software in the near future such as learning of advance excel tools along with other tactics of data analytics like Big data. These leanings would enhance my professional expertise in the context of data analytics.
Reference
Sprent, P. (2019). Data driven statistical methods. Routledge.
Zareei, S. (2018). Project scheduling for constructing biogas plant using critical path method. Renewable and Sustainable Energy Reviews, 81, 756-759.
- 24/7 Customer Support
- 100% Customer Satisfaction
- No Privacy Violation
- Quick Services
- Subject Experts


