Six-Phase Life Cycle Model: Step Dependencies
- 09 Pages
- Published On: 25-05-2024
CRISP-DM
The model for the life cycle consists of six phases with arrows that indicate the most critical and regular step dependencies. The step series is not rigorous. Many programs, in reality, switch back and forth when required between stages. This modular CRISP-DM model can be conveniently customized for data analysis dissertation help. Example, you may want vast quantities of data to be searched without any clear modeling target in order to identify money laundering in your business. Instead, you rely on researching and viewing data to find suspicious trends in financial data instead of modeling. You can build a data mining model that suits your personal needs with CRISP-DM. The phases of modeling, assessment and implementation could be not as important in this situation as the phases of data interpretation and planning. However, some of the issues emerging during these corresponding stages for long-term planning and future data mining targets do need to be addressed.

Business Understanding
A business projection is the estimation of potential sales profits. The initial process concentrates on understanding the project priorities and specifications. Sales estimates are typically based on historical evidence, the dynamics of the market and the state of the existing pipeline (Huber et al., 2019). The business forecasts weekly, daily, quarterly and annual turnover by using the revenue forecast. The feedback reflects any vague language semantics or fuzzy definitions for a given case. We would analyze the revenue outlook for this organization to accomplish this goal. The changes in the database indicate that there needs to be some progress under the fact those reseller transactions. That's because the paper lacks a lot of details. This means that the organization's revenue divide is high (Irawan, 2019).
Any projection can be considered a predictor of what will potentially happen in a given area in the future. The revenue forecast thus shows how much one commodity is expected to be sold in a specific market at the specie penetrating price in a given future timeframe. For an organization to be able to manufacture the amount needed at the right time, accurate revenue forecasts are necessary (Fatima et al., 2020). In addition, it pays for raw mate lines, machinery, personnel etc. in advance. Few companies manufacture the material in advance to satisfy the potential demand, but in general the company manufactures the material in order (Huber et al., 2019).
Predicting involves forecasting potential job numbers, forms and efficiency e.g. revenue. It is very important to properly analyze demand dynamics in ad-deviance for every manufacturing sector. This is a promise by the sales department and this projection will focus on the strategic plans of the whole company. A company management must schedule the estimate of market share, which it would expect to achieve during the forecast period (Fatima et al., 2020). Sales projection, in other words, is an estimation of the company's projected sales prospects. Any schedule is based on the revenue estimates. This clause allows the management to determine the amount of profits to be produced, how much to generate and what men, equipment and money are needed (Fernandes et al., 2019).
Data Understanding and Preparation

Data Modelling: Star schema
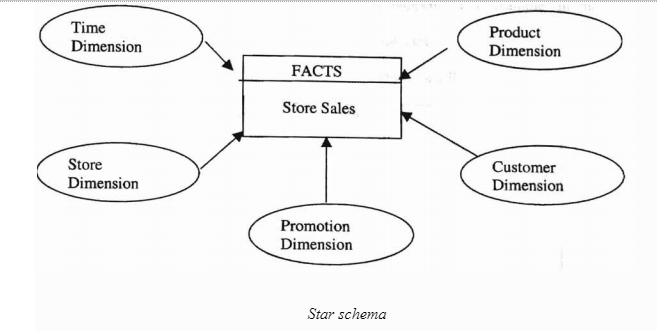
For computational analysis, the data warehouse requires multidimensional data. The data management paradigm should be able to express multidimensionality. Facts and dimensions are the two basic data constructions given by the multidimensional model (Nurmalasari et al., 2019). The researchers should interpret these all structures in the manner that the analyzes are performed. A star schema is a condensed multidimensional model data model that is suitable for the majority of market scenarios. It uses link database semantics from all manner of OLTP schemes, making it conveniently and easily compliant with legacy databases (Mohammed, 2019). One very large table, which is also called the fact Table and several smaller tables, includes a star schema. The DIMENSION Tables are called. Using this method, company aggregate queries will meet requirements when aggregate queries need to contain information and dimensions.

The business typically has to analyze basic details (units or quantities) in a variety of measurements (markets, products, period). Facts like revenue, net income, and expense. The time, position and commodity are standard measurements. For instance, the overall monthly sales of a shop may be demanded. The fact that the question includes "total revenue." is "month" and "store" dimensions (location). Owing to the details and measurements being important elements in an information warehouse, most data warehousing implementations use a similar scheme of holding information in a fact table and tables in a variety of dimensions (Chen et al., 2019). It must be remembered that the fact table is typically considerably wider than all the dimensional tables in the standard star schema. This eventually becomes an important element in the results difficulties relevant to the star scheme.
A star schema consists by way of informative dimension tables of a central data table with metrics you calculate. The aim is to bring together in a table "group all the interesting elements about that business dimension, such as customer or product, into one table." This design maximizes support for decision and analysis (Effendy et al., 2019). Star designs are simpler, and if the user and the data are not protected, the best design techniques should be employed for the following five reasons in the data warehouse design. There are fewer tables with a star schema, but it is relatively easier to learn. Since fewer options, including less tables and less attachments, are available (Elamin, Alzaidi, & Feki, 2018). In their questions the customer is less likely to make errors. Most notably, it helps businesses to "use business descriptions to name the tables, columns and contents of the columns (Mulyana et al., 2020). Eight-character, underscored-type naming conventions." This is done by reducing the number of members since the owner of members is limited to the number of company measurements. Multidimensional processing is also provided in star schemas. This is the "slicing and dicing" of data essential for the study of the iterative process. Star schemes keep the history of comparative analysis, and all market dimensions used for analysis are defined (Zhu et al., 2017).
Evaluation
The forecast sales results impact pricing decisions, marketing strategies and stock prices of state-owned enterprises, as each company relies on the flow of goods. To create a data warehouse that supports the revenue prediction fields requires an understanding of the form of company, the sales period and how selling and pricing decisions are to be made in the sales process. Progressive use of capital such as land, labor and dollars is generally a focus of forecast sellers. Their benefit is from each unit sold at overall sales volumes and margin income. By gathering comprehensive and accurate sales figures, traders can 'store the best-selling goods,' take control of suppliers, and maximize advertising activities (Elamin, Alzaidi, & Feki, 2018). Forecast sellers usually wants to know how sales it does, when it sells, where it sells and how much it is going to sell, whether departmental shops, retail stores, or single products vendors. The source for earnings measurement should be a retail revenue data warehouse. The pace of competition causes major retailers to set up sophisticated data stores to track revenue (Shaked, 2020).
For this case, the original data warehouse design involves the time, location, inventory calculation and a fact sheet including accurate details like the sales units and the dollar's gross sales. It should be viewed as a basic specification for all retailers and, where appropriate for a particular sector, measurements such as client details can be added (Zhu et al., 2017). Reports can be produced with a simplified interface for retail sales to detect how many goods have been selling in a given place and time. Comparable outcomes may be used to assess the aspect that has resulted in the disparity in revenue in each shop including time, place or product variety. Corrections to the outlook, publicity and promotional efforts may also be made (Elamin, Alzaidi, & Feki, 2018).
Take a deeper dive into Social Entrepreneurship, Motivation, and Challenges with our additional resources.
Whilst the star schema modeling is a favored one for data warehousing, several issues with the implementation of the star schema remain, in particular if a query-centered star schema is hosted on an OLTP-optimized conventional RDBMS. As star schema usually involves the entire hierarchy of attributes, index technology is being used to optimize the results. But in the fact table, the composite dimension key contains all segments which increase the index size and ultimately have an effect on both performance and scalability.

Reference
- Chen, L., Gao, Y., Zhang, Y., Jensen, C. S., & Zheng, B. (2019, April). Efficient and incremental clustering algorithms on star-schema heterogeneous graphs. In 2019 IEEE 35th International Conference on Data Engineering (ICDE) (pp. 256-267). IEEE.
- Effendy, M. R., Kusumasari, T. F., & Hasibuan, M. A. (2019, October). Star Schema Implementation For Monitoring in Data Quality Management Tool (A Case Study at A Government Agency). In 2019 Fourth International Conference on Informatics and Computing (ICIC) (pp. 1-6). IEEE.
- Elamin, E., Alzaidi, A., & Feki, J. (2018). A semantic resource based approach for star schemas matching. International Journal of Database Management Systems (IJDMS) Vol, 10.
- Fatima, F., Talib, R., Hanif, M. K., & Awais, M. (2020). A Paradigm-Shifting From Domain-Driven Data Mining Frameworks to Process-Based Domain-Driven Data Mining-Actionable Knowledge Discovery Framework. IEEE Access, 8, 210763-210774.
- Fernandes, E., Holanda, M., Victorino, M., Borges, V., Carvalho, R., & Van Erven, G. (2019). Educational data mining: Predictive analysis of academic performance of public school students in the capital of Brazil. Journal of Business Research, 94, 335-343.
- Huber, S., Wiemer, H., Schneider, D., & Ihlenfeldt, S. (2019). DMME: Data mining methodology for engineering applications–a holistic extension to the CRISP-DM model. Procedia Cirp, 79, 403-408.
- Irawan, Y. (2019). Implementation Of Data Mining For Determining Majors Using K-Means Algorithm In Students Of SMA Negeri 1 Pangkalan Kerinci. Journal of Applied Engineering and Technological Science (JAETS), 1(1), 17-29.
- Mohammed, K. (2019). Data Warehouse Design and Implementation Based on Star Schema vs. Snowflake Schema. Int. J. Acad. Res. Bus. Soc. Sci, 9.
- Mulyana, A., Abadi, B. H., Rachman, A. A., & Widianto, S. R. (2020, February). Rancang Bangun Data Warehouse Berbasis Star Scheme StudiKasus: SMK Negeri 4 Garut. In Seminar Nasional Teknologi Komputer & Sains (SAINTEKS) (Vol. 1, No. 1, pp. 27-29).
- Nurmalasari, D., Zulvi, M. S., & Hanifah, P. (2019). Performance Analysis Of Star Schema Data Modeling On Library Data. Jurnal Komputer Terapan, 5(2), 44-53.
- Shaked, G. (2020). U.S. Patent No. 10,733,155. Washington, DC: U.S. Patent and Trademark Office.
- Zhu, J., Potti, N., Saurabh, S., & Patel, J. M. (2017). Looking ahead makes query plans robust: Making the initial case with in-memory star schema data warehouse workloads. Proceedings of the VLDB Endowment, 10(8), 889-900.
- 24/7 Customer Support
- 100% Customer Satisfaction
- No Privacy Violation
- Quick Services
- Subject Experts


