Statistical Analysis of Refugee Acceptance in European Union Countries
Data Analysis and ResultsT
This section presents the statistical analysis and findings on the relationship between refugee acceptance among European Union countries and their size, population, literacy rates, weighted conflict index and labour market. The labour market in each country has been split into two components: the work force in industry and the workforce in agriculture. Linear regression analysis was employed to explore the relationship between the refugee acceptance rates as the dependent variable and a country’s size, population, time since the occurrence of conflicts, literacy rates, the severity of the conflict, given by the weighted conflict index, work force in industry and work force in agriculture as the independent variables. This analysis is crucial for those seeking statistics dissertation help.
Summary Statistics
The summary statistics with respect to the independent variables in the study were obtained and the results were as summarized in Table 1:

Refugee Acceptance
From the year 1900 up to 1995, relatively fewer refugees who sought asylum were accepted by EU member states. However, between the year 1998 and 2001, there was a drastic increase in the number of refugees who were granted asylum in these countries. The numbers then declined and remained low between the year 2000 and the year 2005. However, between 2006 and 2010, there was a sudden increase, the second one since 1998. This is as visualized in Figure 1.1:


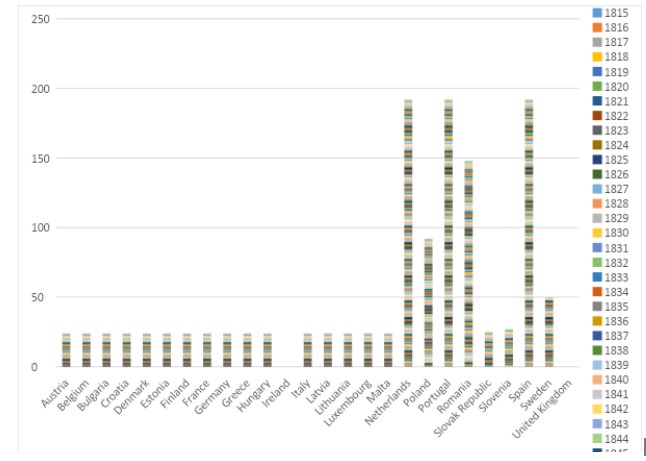
The number of refugees per country since the year 2000 is as illustrated in Figure 1.2:
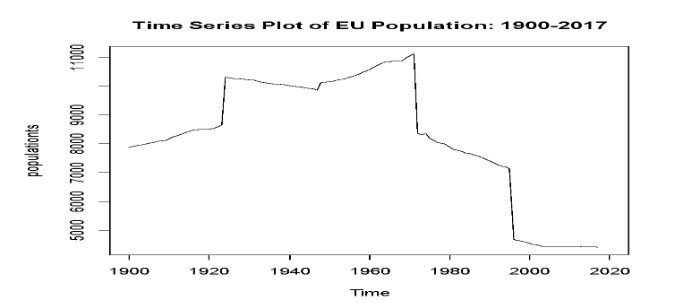
EU Population
From a visual perspective, there seems to be minimal or no relationship between the total population of the countries that comprise the European Union and the number of refugees accepted into these states. From the year 1900 up to around 1925, there was a gradual increase in the EU population, followed by a steep increase in 1926. Thereafter, there was a gradual decrease up to 1950, after which the EU population rose steadily, hitting the peak in the year 1970. Since then, the population has gradually declined as visualized in Figure 2:
Regression Analysis
In order to determine the association between the refugee acceptance rate and each of the independent variables in the study, linear regression analysis was conducted at the 5% level. This is due to the fact that linear regression analysis can be used to assess the statistical relationship between predictor variables and response variables, as well as the statistical significance of each predictor variable at a given significance level (Schneider, et al., 2010). In this study, the response variable was the number of refugees accepted by EU member states, whereas the country’s size, population, literacy rates, work force in industry, work force in agriculture and weighted conflict index were the predictor variables. The output obtained when a linear regression model was fitted to the dataset is as summarized in Table 2:

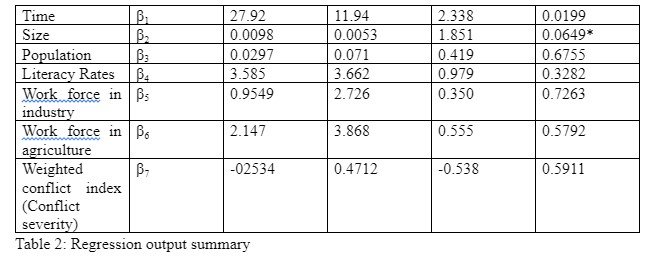
From Table 2, inference can be made on the research hypotheses in the study as follows:
Continue your journey with our comprehensive guide to Multifaceted Analysis of Efficacy Through Guided.
Hypothesis one
Ho: The refugees’ acceptance rate depends on the time since the occurrence of the conflict. Versus Ha: The refugees’ acceptance rate does not depend on the time since the occurrence of the conflict From Table 2, it is evident that there is a positive association between the occurrence of conflicts and the refugee acceptance rate. As the duration since the conflict occurred increases, EU member states tend to accept more asylum seekers. On the contrary, when the duration is short, EU member states tend to accept fewer refugees. From the p-value, 0.0199, which is lower than the significance level of 0.05, the null hypothesis is accepted and a conclusion made that the refugees acceptance rate depends on the time since the occurrence of the conflict. As more time passes since the occurrence of the conflict, the refugee acceptance rates tend to rise. Shorter durations on the other hand, are associated with lower acceptance rates, all other factors held constant.
Hypothesis Two
Ho: The refugees’ acceptance rate depends on the weighted conflict index of a European Union member state Versus Ha: The refugees’ acceptance rate does not depend on the weighted conflict index of a European Union member state From Table 2, it is evident that there is a negative association between the weighted conflict index and the refugees’ acceptance rates. When conflicts are highly severe, less refugees are accepted by EU member states. Less severe conflicts are consequently associated with higher refugee acceptance rates. However, from the p-value, 0.591, which is significantly higher than the significance level of 0.05, the null hypothesis is rejected and a conclusion made that the refugees acceptance rate does not depend on the weighted conflict index. Refugees who have been affected by less or more severe conflicts are equally likely to be accepted by the EU member states, all other factors held constant.
Hypothesis Three
Ho: The refugees’ acceptance rate depends on the physical size of a European Union member state Versus Ha: The refugees’ acceptance rate does not depend on the physical size of a European Union member state From Table 2, it is evident that there is a negative association between the physical size of a state and the number of refugees it accepts. Larger countries tend to accept lower numbers of refugees whereas smaller countries tend to accept more refugees. From the p-value, 0.0649, which is higher than the significance level of 0.05, the null hypothesis is rejected and a conclusion made that the refugees acceptance rate does not depend on the physical size of a European Union member state. Small and large countries are equally likely to accept or reject new refugees. However, if a significance level of 10% is used, then size becomes a significant variable in the study.
Hypothesis Four
Ho: The refugees’ acceptance rate depends on the population of a European Union member state Versus Ha: The refugees’ acceptance rate does not depend on the population of a European Union member state From Table 2, it is evident that there is a positive association between the population of a state and the number of refugees it accepts. Countries with higher populations tend to accept higher numbers of refugees whereas countries with relatively lower populations tend to accept fewer refugees. However, from the p-value, 0.419, which is higher than the significance level of 0.05, the null hypothesis is rejected and a conclusion made that the refugees acceptance rate does not depend on the population of a European Union member state. Countries with large and small population sizes are equally likely to grant asylum to refugees to decline to do so.
Hypothesis Five
Ho: The refugees’ acceptance rate depends on the literacy rates of a European Union member state Versus Ha: The refugees’ acceptance rate does not depend on the literacy rates of a European Union member state From Table 2, it is evident that there is a positive association between the literacy rates of a state and the number of refugees it accepts. Countries with higher literacy levels tend to accept higher numbers of refugees whereas countries with relatively lower literacy rates tend to accept fewer refugees. However, from the p-value, 0.328, which is higher than the significance level of 0.05, the null hypothesis is rejected and a conclusion made that the refugees acceptance rate does not depend on the literacy rates of a European Union member state. Countries with high and low literacy rates are equally likely to grant asylum to refugees to decline to do so.
Hypothesis Six

Ho: The refugees’ acceptance rate depends on the work force in industry in a European Union member state Versus Ha: The refugees’ acceptance rate does not depend on the work force in industry in a European Union member state From Table 2, it is evident that there is a positive association between the work force in industry in a state and the number of refugees it accepts. Countries with larger industry labour markets tend to accept higher numbers of refugees whereas countries with relatively smaller industry labour markets tend to accept fewer refugees. However, from the p-value, 0.726, which is significantly higher than the significance level of 0.05, the null hypothesis is rejected and a conclusion made that the refugees acceptance rate does not depend on the labour market in industry in a European Union member state. Countries with small and large compositions of labour working in industry are equally likely to grant asylum to refugees to decline to do so.
Hypothesis Seven
Ho: The refugees’ acceptance rate depends on the work force in the agriculture sector in a European Union member state Versus Ha: The refugees’ acceptance rate does not depend on the work force in the agriculture sector in a European Union member state From Table 2, it is evident that there is a positive association between the work force in the agriculture sector in a state and the number of refugees it accepts. Countries with larger agriculture labour markets tend to accept higher numbers of refugees whereas countries with relatively smaller agriculture labour markets tend to accept fewer refugees. However, from the p-value, 0.579, which is significantly higher than the significance level of 0.05, the null hypothesis is rejected and a conclusion made that the refugees acceptance rate does not depend on the labour market in the agriculture sector in a European Union member state. Countries with small and large compositions of labour working in the agriculture segment of the economy are equally likely to grant asylum to refugees to decline to do so.
Discussion
In the recent years, there European member states have received widespread criticism from humanitarian organizations regarding the treatment they have accorded refugees in the past. According to Human Rights Watch (2018), member states have been reluctant to accept asylum seekers. For instance, in the year 2017, the European Commission initiated proceedings against the Czech Republic, Poland and Hungary for contravening the binding plan to relocate refugees. In light of these developments, this study sought to explore the relationship between the refugee acceptance rates and the physical size, population, labour markets, literacy rates and weighted conflict indices of EU member states. From the results obtained it is evident that there is a negative association between the size of a member state and the number of refugees its accepts. Smaller countries tend to accept more asylum seekers whereas larger states accept lower numbers. On the contrary, there is a positive association between the population of a member state and the number of asylum seekers it accepts. Countries with relatively larger populations tend to accept more refugees. Similarly, there is a positive association between the number of refugees accepted by a member state and its labour market and literacy rates. The statistical association between the number of refugees and the weighted conflict index is a negative one. In summary, a regression equation that portrays the relationship between the number of refugees accepted and the independent variables is as follows: Refugees= -0.0065 Size + 0.0251 Population + 2.301 Literacy Rates + 0.1302 Work force in industry + 1.815 Work force in agriculture - 0.2871 From the results in Table 2, it is evident that the p-values for each of the predictor variables is higher than 0.05. Consequently, the physical size of a European Union member state, its population, literacy rates, labour market and weighted conflict index do not have a significant impact on the number of asylum seekers it accepts.
Continue your exploration of Socio-Economic Factors on the UK Retail Industry in 2020 with our related content.
References
Human Rights Watch. (2018, September 3). European Union: Events of 2017. Retrieved from Human Rights Watch:
https://www.hrw.org/world-report/2018/country-chapters/european-union Shneider, A. H. (2010). Linear Regression Analysis. Deutsches Arzblatt International, 776-782.
R Codes
data<-read.csv(file.choose(), header=T)str(data)
size<-data$size
Refugees<-data$Refugees
agriculture<-data$agriculture
industry<-data$industry
work.force.in.industry<-data$industry
work.force.in.agriculture<-data$agriculture
weighted.conflict.index<-data$conflict<
population<-data$population
Education<-data$literacy
time<-data$Year
regression.data<-data.frame(Refugees,time, size,work.force.in.industry , work.force.in.agriculture, weighted.conflict.index, population, Education)
str(regression.data)
model<-lm(Refugees~., data=regression.data)
summary(model)
refugeests<-ts(Refugees, start=1815, end=2017)
plot(refugeests)
plot(refugeests, xlim=c(1900,2020))
title("Time Series Plot of Refugees: 1900-2017")
populationts<-ts(population, start=1900, end=2017)
plot(populationts, xlim=c(1900,2020))
title("Time Series Plot of EU Population: 1900-2017")
agriculturets<-ts(agriculture, start=1900, end=2017)
plot(agriculturets, xlim=c(1900,2020))
title("Time Series Plot of EU Work Force in Agriculture: 1900-2017")


- 24/7 Customer Support
- 100% Customer Satisfaction
- No Privacy Violation
- Quick Services
- Subject Experts