Understanding Bullying in Northern Ireland Schools
- 18 Pages
- Published On: 30-11-2023
Introduction
While there is a growing body of research on the causes, prevalence, and correlates of bullying worldwide, much of it has been country- and region-specific and sporadic in character (Smith, Morita, Junger-Tas, Olweus, Catalano, and Slee, 1999). Many studies conducted on bully/victim issues among students in Northern Ireland have taken a sporadic approach, placing different emphasis on methodological issues like the time-reference period for the events to have occurred and whether or not questionnaires are used that would allow for cross-national comparisons (Collins, Mc Aleavy, and Adamson, 2004; Livesey, Mc Aleavy, Donegan, Duffy, O’Hagan, Adamson, and White, 2007). If you are seeking psychology dissertation help, it's crucial to consider these methodological nuances to ensure a comprehensive and cross-cultural understanding of bullying dynamics.
The Northern Ireland Social and Political Archive, or ARK, conducts the YLTS each year (ARK, 2006). The 16-year-olds' perspectives and experiences are documented by YLTS in Northern Ireland. Although the YLTS is not only concerned with school-related concerns, but its representative character also provides valuable information on problems that impact teenagers in Northern Ireland.

Would you say that students at your school are bullied by other students? was one of the items on the inaugural YLTS (1998, n = 397) that included bully/victim-related questions. According to responses to this question, Mc Guckin and Lewis (2006) came to the conclusion that Northern Ireland (76.8%, n = 305) may have a higher incidence of school bullying than the rest of the United Kingdom, the Republic of Ireland, and more remote region.
I was bullied at school was a question that was added in the second YLTS (2004, n = 824) that included bully/victim-related questions. The 2004 survey also included the General Health Questionnaire - 12 item (GHQ-12) (Goldberg and Williams, 1988), a measure of psychological well-being (e.g., "Lost much sleep over worry? "), as well as two stress-related questions ("How often do you get stressed? ", "What makes you stressed? "), in recognition of the paucity of information regarding adolescent psychological well-being in Northern Ireland.
Mc Guckin et al. found that just 13% (n = 107) of respondents reported being bullied "often or more often," which is a clear departure from the findings from the 1998 study. Over a quarter (23.8%, n = 189) of those with psychological impairments met the criteria for "caseness" on the GHQ-12, demonstrating sufficiently poor psychological health to necessitate referral. In line with the low incidence of victimization observed, nearly two-thirds (65.7%, n = 541) of respondents who responded to the first stress-related question said they were stressed "sometimes or more often." However, only five respondents specifically mentioned bully/victim problems when responding to the second stress-related question.
By evaluating data gathered as part of the 2005 version of the YLTS, the current study sought to complement previously published research findings in Northern Ireland by examining the experience of school bullying among Northern Ireland teenagers.
Methods
Respondents
The Child Benefit Registry revealed a total of 2,049 16-year-olds who qualified to participate in the poll (Child Benefit is a non-means-tested State Benefit that is paid to parents for each of their children). Participants had to meet the following requirements in order to be eligible: (i) be born in Northern Ireland and reside there; (ii) turn 16 in February 2005; and (iii) have Child Benefit claimed on their behalf. 819 people were invited to participate; 41.4% of them were men (n = 339) and 58.4% were women (n = 478).
Measure
In 2005, the YLTS questionnaires contained two stress-related questions, the GHQ-12, and eight items relating to personal experience of bully/victim difficulties.
Bullying/Victim Questions
During the "Education" module, respondents were given eight questions about bullies and victims (Questions 22 through 29, inclusive). Whilst the response options for some questions was either ‘Yes’ or ‘No’, other questions provided an additional option of ‘Don’t know’. Response options for other questions ranged from ‘A lot’, ‘A little’, to ‘Not at all’, while one question included a further response option to this of ‘Don’t know’. Response options for the remaining question were ‘Would talk to them’, ‘Would not talk to them’, ‘It depends’, and ‘Don’t know’.
Psychological Well-being
Respondents were asked to complete the 12-item General Health Questionnaire in order to examine psychological well-being (presented as Question 32 through Question 43 inclusive in the YLTS questionnaire). The GHQ-12 is a self-administered screening tool used in community and non-psychiatric settings to identify mild psychiatric problems (i.e., non-psychotic psychological impairment). It is sensitive to changes in normal functioning 'during the past few weeks' and has the ability to differentiate between 'cases' (i.e., the possibility that the individual has a minor psychiatric condition) and 'non- cases'. Previous surveys conducted in Northern Ireland have used the GHQ-12.
On a four-point severity scale, respondents are asked to grade themselves based on how recently they have experienced each item. Whilst the response options for some question ranged from 'not at all', through 'no more than usual', 'rather more than usual' to 'much more than usual', response options for the remaining questions ranged from 'better / more so than usual', through 'same as usual', 'less than usual', to 'much less than usual'. Higher scores were recoded for all items to reflect lower levels of psychological well-being. No items were scored in reverse. The GHQ-12 can be graded in a number of ways. Both the Likert scale and the "caseness" approach were used for the analyses in the current study. Higher scores on the Likert scale are indicative of diminished psychological wellbeing. Responses are averaged across the spectrum in the Likert approach. Under the caseness approach, respondents scoring above a specified threshold score (4) are regarded to be demonstrating enough poor psychological well-being to be labelled a 'case'.
Stress
Respondents were asked, "How often do you get stressed?" (Question 44), with responses graded on a five-point scale (i.e., "Very often," "Often," "Often," "Rarely," and "Never").
Results
Personal Experience of Bullying
Table 1: Personal experience of victimisation

As per table 1, 29.8% participants had experienced bullying in school while 68.3% respondents said that they never experienced bullying in their school.

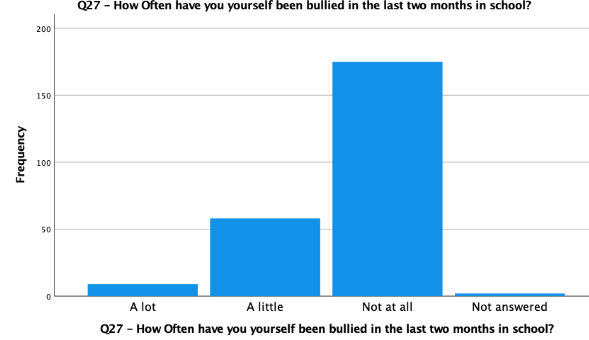
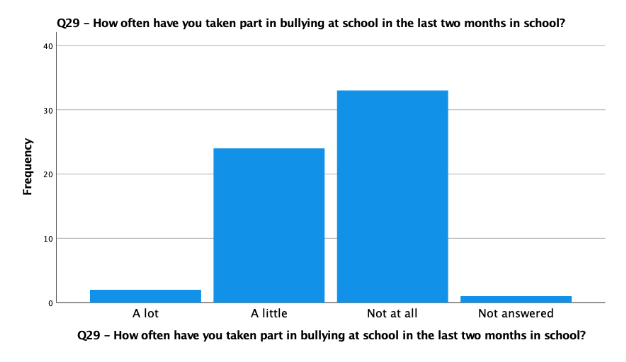
Frequency of Bullying
Table 2: Frequency of bullying
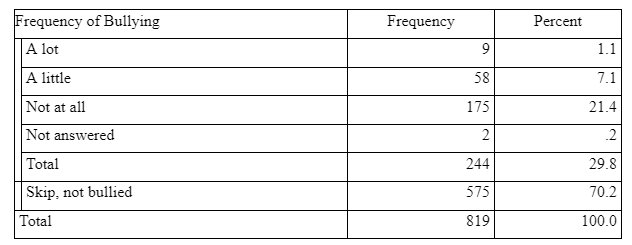
As per table 2, 1.1% participants had experienced bullying ‘a lot’ in school while 7.1% respondents said that they experienced ‘a little’ bullying in their school.
Bullied Others
Table 3: Bullied others
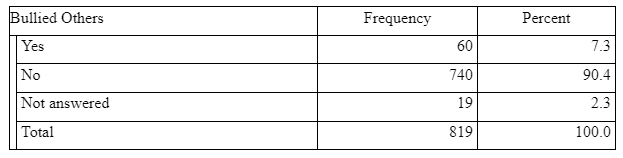
As per table 3, 7.3% participants agreed bullying other in school while 90.4% respondents said that they never bullied others in their school.

Frequency of Bullying others
Table 4: Frequency of Bullying others
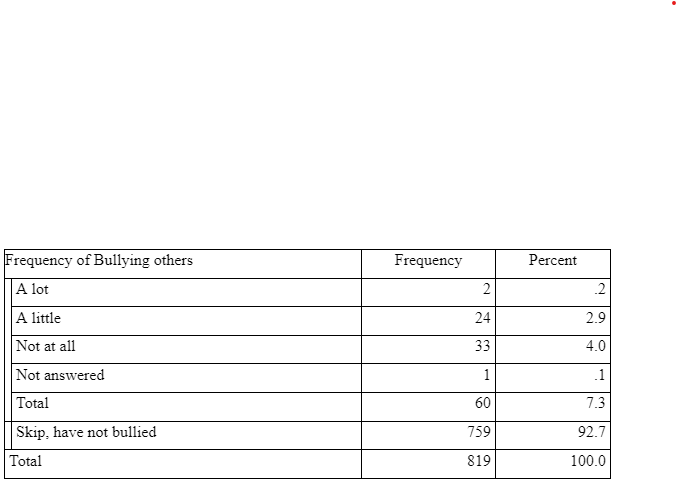
As per table 4, 0.2% participants agreed a lot bullying other in school while 2.9% respondents said that they bullied others a little in their school.
Knowledge of Victimization at School and School Management
Table 5: Knowledge of Victimization at School and School Management

As per table 5, only 10.9% respondents felt that the staff/school management had a lot of Knowledge of Victimization at School while 68.5% respondents felt that they had only a little knowledge of victimisation.

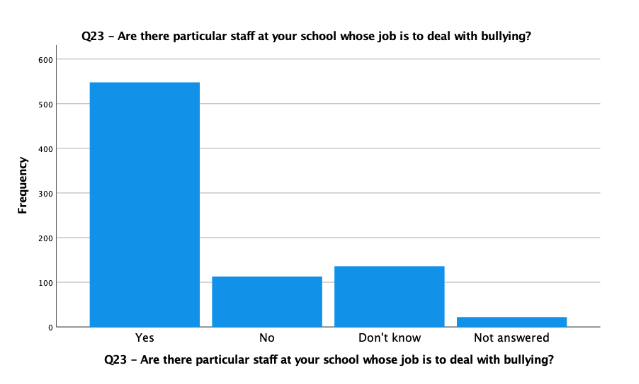
Responsible Staff
Table 6: Responsible Staff
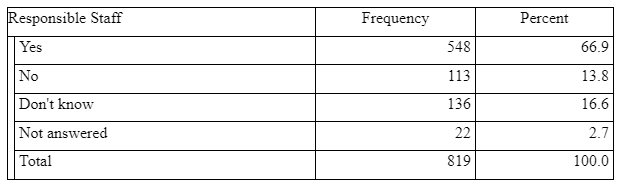
As per table 6, 66.9% respondents agreed that there is a responsible staff to keep a check on such activities while 13.8% respondents said that there is no such facility. Finally, 16.6% respondents didn’t had any idea regarding this.
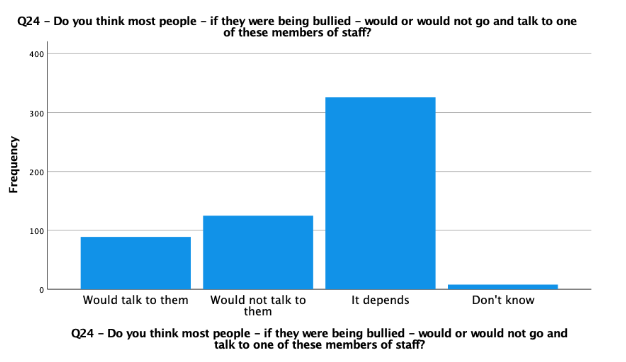
Discussing victimisation with Staff member
Table 7: Discussing victimisation with Staff member

As per table 7, 10.9% respondents said that they would like to talk with the responsible staff for activities such as bullying while 15.3% respondents said that there would not like to discuss such activities with any staff member.
Role of responsible staff in stopping bullying
Table 8: Role of responsible staff in stopping bullying
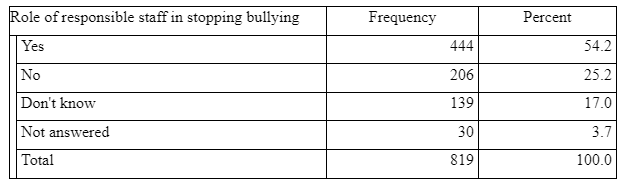
As per table 8, majority of the respondents (54.2%) agreed that school staff pays an important role in stopping such activities in school. However, 25.2% of the respondents feel that school staff do not play a huge role in stopping bullying at school.

Figure 8: Role of responsible staff in stopping bullying
Table 9: Psychological well-being score
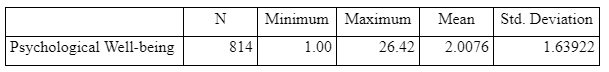
The complete sample of respondents (n = 814) received an average psychological well-being score of 2.00 (SD = 1.63), which shows that there is very little psychological impairment among the respondents. Additionally, using the "caseness" technique to scoring, it was discovered that only 1.2% (n = 10) had scores on the measure that were high enough to meet the "caseness" requirements.
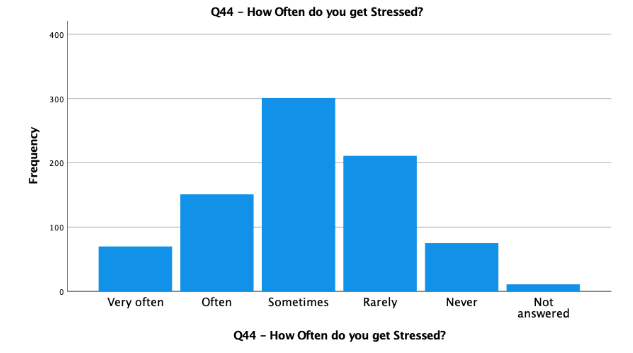
Frequency of Stress
Table 10: Frequency of Stress
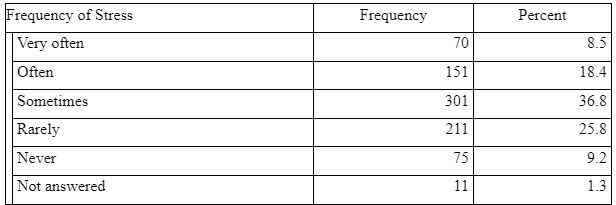

As per table 10, 8.5% respondents very often remain in stress, 18.4% often remain in stress, 36.8% sometimes remain in stress and 25.8% rarely remain in stress.
Association between experience of victimisation, stress and psychological well-being
Table 11: Association between experience of victimisation, stress and psychological well-being
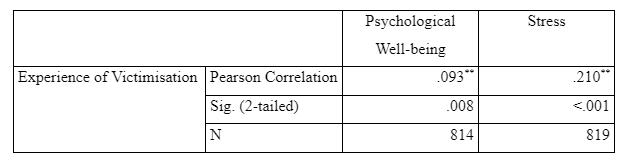
As per Pearson’s correlation analysis, there was significant but weak positive correlation between victimisation and psychological well-being, and significant but weak positive correlation between victimisation and stress.
Association between psychological well-being and stress

Table 12: Association between psychological well-being and stress


As per Pearson’s correlation analysis, there was significant but weak positive correlation between stress and psychological well-being.
Comparing psychological well-being, Victimisation and Stress between Cases and non-cases.
Table 13: Comparing Psychological Well-being
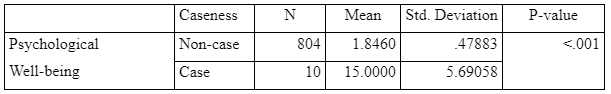
The mean psychological wellbeing score for non-case was 1.84 (SD = .47) and that of case was 15.0 (SD = 5.69). As per independent t-test, t(812) = -54.02; p <.001. Since the p-value is coming out to be less than the critical alpha value of .05, it can be said that there is significant difference in psychological well-being score between case and non-case. Psychological well-being score was significantly higher for cases as compared to non-cases.
Table 14: Comparing Stress

The mean stress score for non-case was 4.16 (SD = 10.15) and that of case was 12.50 (SD = 30.41). As per independent t-test, t(812) = -2.47; p = .014. Since the p-value is coming out to be less than the critical alpha value of .05, it can be said that there is significant difference in stress score between case and non-case. Stress score was significantly higher for cases as compared to non-cases.
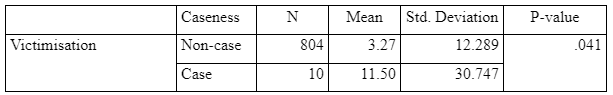
The mean victimisation score for non-case was 3.27 (SD = 12.28) and that of case was 11.50 (SD = 30.74). As per independent t-test, t(812) = -2.04; p = .041. Since the p-value is coming out to be less than the critical alpha value of .05, it can be said that there is significant difference in victimisation score between case and non-case. Victimisation score was significantly higher for cases as compared to non-cases.
Conclusion
Thus, it can be concluded that the YLTS has considerably increased our understanding of the bully/victim issues in Northern Ireland. These representative surveys provide crucial information for researchers looking to comprehend the nature, prevalence, and correlations of bully/victim issues among Northern Ireland schoolchildren. Future research should, however, take a more methodologically sound stance and should use content that has been pre-designed to allow for meaningful national and international comparisons.
References
ARK (2006). ARK. Northern Ireland Life and Times Survey, 2005. [Online]. Access from:
Goldberg, D., and Williams, P. (1988). A User’s Guide to the General Health Questionnaire, Windsor: NFER-Nelson. School Bullying in Northern Ireland.
Livesey, G., Mc Aleavy, G., Donegan, T., Duffy, J., O’Hagan, C., Adamson, G., and White, R. (2007). The Nature and Extent of Bullying in Schools in North of Ireland. Research Report No. 46, Bangor, Northern Ireland: Department of Education for Northern Ireland.
Mc Guckin, C., and Lewis, C. A. (2006). Experiences of school bullying in Northern Ireland: Data from the Life and Times Survey. Adolescence 41, 313-20.
Mc Guckin, C., Lewis, C. A., and Cummins, P. K. (in press). Experiences of school bullying, psychological well-being and stress in Northern Ireland: Data from the 2004 Young Life and Times Survey. Irish Journal of Psychology.
Smith, P. K., Morita, Y., Junger-Tas, J., Olweus, D., Catalano, R., and Slee, P. (Eds.) (1999), The Nature of School Bullying: A Cross-National Perspective. London and New York: Routledge.
Continue your journey with our comprehensive guide to Understanding and Addressing Obesity.


- 24/7 Customer Support
- 100% Customer Satisfaction
- No Privacy Violation
- Quick Services
- Subject Experts