Assessing Salesperson Loyalty
Introduction
The present research is conducted in order to determine the salesperson loyalty and its impact on various factors. Salesperson loyalty is the major concern for the Boeing Company because Mr. McNerney, the CEO as of 2011 of Boeing Company, wants to put a very strong marketing and sales organization in place to take advantage of the opportunities that lie ahead for the 787 Dreamliner which made its international debut on 18 July 2010. His years of experience have shown that salesperson loyalty is very important because of the long-term nature of contracts with the major air carriers of the world. That’s why he wants to develop his business-to-business sales force in the future through improved selection, training, and leadership of Boeing salespersons. Loyalty of the salespersons are depended upon various factors. For assessing the influence of employee’s loyalty,’ employee’s loyalty is the dependent variable and other all the factors are dependent variables. That’s why survey has been done to compare employee loyalty with various factors like age, gender, length of employment, ethnicity, satisfaction from the job, status of working etc. which are analyzed with the view of understanding the influence of these factors on salesperson loyalty. Additionally, seeking marketing dissertation help can provide valuable insights into the complexities of this research area.
Part 1
Within the 1000 respondents (Figure 2), 737 participants are full time employed. This is the major group which is followed by part time employees, not employed persons are 135 and 116 respectively. Other than these groups, persons who are employed on temporary basis, persons who are employed on a Contract basis and retired employees, all are very small in number respect to those major groups.

As per the data, there were a total for 1000 (Figure 1) participants. 52.2 percent (522) of the participants were male while remaining 47.8 percent (478) of the participants were female within the range of ages 18 to 65 years. All respondents were from the United States and the Canadian metropolitan areas of Toronto and Montreal with birth year varying from 1934 to 1981.


In this data set, all information is not relevant. The analysis should be done within the context of present scenario that’s why the information obtained from the respondents who are retired or not employed, are not considered as they are not significant in this analysis. So relevant data is extracted for the further analysis.
In this dataset, birth year is a variable. Age of every respondents is calculated from the birth year to 2010 and new variable “Age” is computed. The range of age of all respondents in this data set is within 29 to 76. According to the descriptive statistics, the mean age is 49.9 with standard deviation 11.9 years. From this information, it can be obtained that age of most of the respondents is varying within the range of 38 years to 51 age approx. (Mean ± standard deviation).
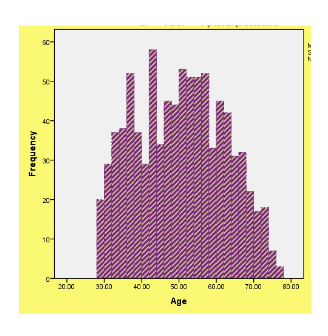
According to the gender, female respondent’s mean age is 51 where male respondent’s mean age is 49 with almost same standard deviation. From this, it can be concluded that female salesperson have slightly more experienced than the male respondents according to this data set.

For exploring the relationship between gender and marital status of the respondent, chi square test was done. Chi square test has been done for understanding the association within two different attributes. The null hypothesis is accepted as the p-value is greater than chosen significance level (α = 0.05), (figure 5) which proved that there is no association between gender and marital status.
H0: There is no association between gender and marital status
. H1: There is an association between gender and marital status

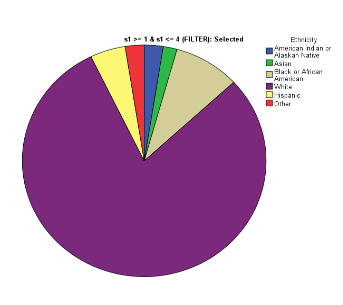
There are 9 types of ethnicity is depicted here. According to the response, almost 80% respondents are White while other category people are occupied less than 3%. From this it can be concluded that the sales person of the United States and the Canadian metropolitan areas of Toronto and Montreal are mostly white people.
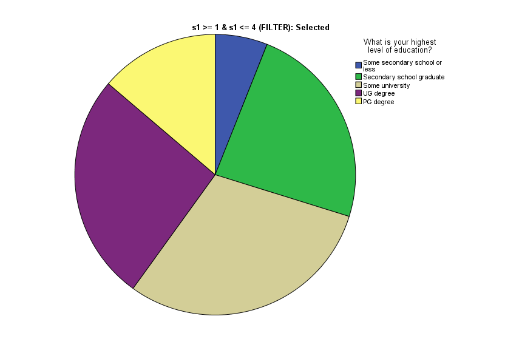
According to the responses of highest level of education, 30.1 percent of respondents have passed from some university followed by 26.3 percent of respondents with UG degree, 24 percent of respondents graduating from secondary school, and 13.8 percent of respondents with PG degree and 6 percent with in secondary school level. From this it can be concluded that most salesman are graduated.
In income variable 86 missing value is found and it is imputed by mean imputation method. The range of income of all respondents in this data set is under 25000$ to more than 150000$ in a month. According to the descriptive statistics, the mean income is varying from 40000$ to 60000$.

Part 2
For comparing mean score between Gender and employees’ loyalty, t test has been performed. As gender is a categorical variable having two categories female. That’s t test can be done. The chosen significance level is 0.05 (Figure 9). As the p value .004 is lesser than the significance value, null hypothesis is rejected and it can be settled that the mean of employees’ loyalty is significantly different in male and female and gender variable has an impact on employees’ loyalty.
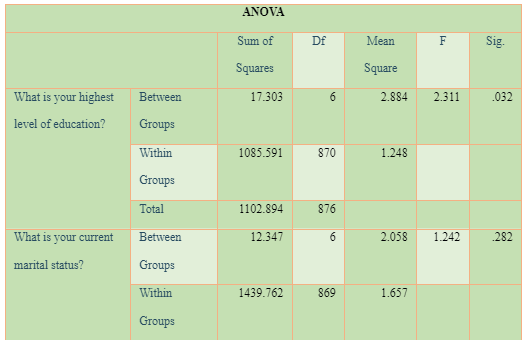
ANOVA table (Figure 10) compares the impact of the different demographics like ethnicity, income, highest level of education, current marital status, other than demographics, length of employment in current position, plan to change job in next 5 years, number of jobs in past 5 years on employee’s loyalty. The table shows that the p-value or the significance value of the some independent variables comes out to be 0.000 which is lower than 0.05. It means that obtainable null hypothesis is rejected and the alternative hypothesis is accepted. It depicted that there is statistically significant difference between those variables which are length of employment in current position, plan to change job in next 5 years and number of jobs in past 5 years in the context of employee’s loyalty. According the ANOVA table, other independent variables comes out to be more than 0.05 (Dahiru, 2008). It means that obtainable null hypothesis is accepted. It depicted that there is no statistically significant difference in respect to employee’s loyalty. Those variables are ethnicity, income, highest level of education, current marital status.
Task 2: To investigate the difference in mean scores of the in employee loyalty based on the perceptions of the employment conditions or overall satisfaction
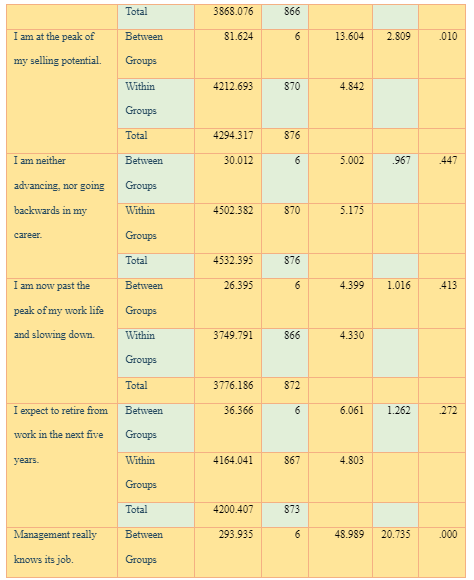
ANOVA test is needed for exploring the significant differences in mean (Kim, 2014). The dependent variable have to be continuous in ANOVA. For this reason employee’s loyalty is transformed into continuous variable. ANOVA table (Figure 11) is used to explore the effect perceptions of the employment conditions or overall satisfaction on employees’ loyalty. The p-value or the significance value of the some independent variables comes is obtained as lower than 0.05 from the table. It means that obtainable null hypothesis is rejected and the alternative hypothesis is accepted. It depicted that there is statistically significant difference between those variables from the stand point of employee loyalty. Those employment conditions are almost all strength of agreement which are reflected in employee loyalty. Whereas almost all agreement of fitting of work according to the employee, comes out to be more than 0.05. It means that obtainable null hypothesis is accepted. Which concluded that there is no statistically significant difference in respect to employee’s loyalty.
Task 3: A model to predict salesperson loyalty to the employer and same model to predict employer loyalty to the salesperson:
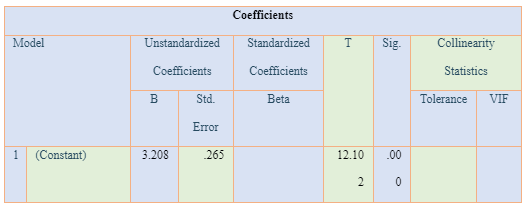
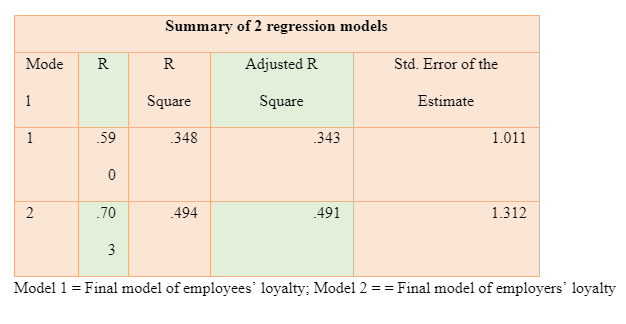
In the given problem, a model has to be build where the dependent variable, employee loyalty to the employer is a categorical variable having values 1(strongly disagree) to 7(strongly agree). Those independent variable having higher correlation is selected. Employee loyalty is a dependent variable that’s why linear regression model has established with some independent variable which are expected that this variable will explain the dependent variable employee loyalty according to the correlation table (Pandis, 2016) .For exploring the impact on employees’ loyalty score of all explanatory variables gender, loyalty of the employer, satisfaction because of employee benefit, compared to others employee benefit is generous, level of interesting job, number of jobs in last 5 years, staying in current position etc., are analyzed through linear regression. According to the model fitting information, the significant value came out less than 0.005 which proves that the model was valid. According to the coefficient table, the significance value of some variables comes more than 0.05, that’s why this variables was removed from the model and final model is selected with only those independent variables whose signifance value is lesser than 0.05. The final mode has been established with 7 independent variables which variables are describing significantly the model. Multicollinearity detection test also have been done through the Variance Inflation Factor, which is just the reciprocal of the tolerance statistics. A VIF of greater than or equal to 10 is generally considered as evidence of multicollinearity. According to the co efficient table all VIF are lied in 1-1.4 (Figure 13) and it depicted that this model has no multicollinearity issue. A value of R, 0.60, indicates such a decent level of forecasting employees’ loyalty by this selected model. This model is able to explain 34% of the dependent variable which is not bad and each and every independent variable is giving significantly to the model according to the result of model 1 summary, The F-test (65.074) is highly significant, thus it can be assumed that there is a linear relationship between the variables in the model (Figure 12). P value is less than .05 also indicates that the regression model is a good fit of the data. Other than that ANOVA table shows the p value is less than .05 which proved that independent variables statistically significantly predict the dependent variable.
The final model:
Employee loyalty = 3.208 + .324(How loyal is your current employer to you) + .238(Gender) -1.08(what is highest level of education) + .098(My job is interesting) -.099 (How many job you have in past 5 years) +.085(I am doing something worthwhile to the job) + .113(How long have you been in your current position) (Figure 13)
Another regression model with selected independent variables (from correlation table) was established for evaluating impact of dependent variable employers’ loyalty. A value of R, 0.70, indicates such a decent level of forecasting employees’ loyalty by this selected model. This model is able to explain 49% of the dependent variable which is not bad and each and every independent variable is giving significantly to the model according to the result of model 2 summary,
The model:
Employee loyalty = -1.399 + .418(How loyal is your current employer to you) + .150(My customers are fair) + .388(Management really know its job) +.154(Management here really interested in the welfare of its employees) (Figure 15)
Recommendation
Different situations like the level of job to be interesting, proper management of employer, getting paid higher, group work, employer loyalty and age all have significant impact on employees’ loyalty. The mean of employees’ loyalty is significantly different in male and female according to the result of the t test which proves that gender variable have the impact on employees’ loyalty. According to the result of ANOVA, the mean of employees’ loyalty is significantly different for all these independent variables like different employer loyalty, stability in current position of job, number of job in past 5 years and planning to change the job in next 5 years which proves that stability in current position of job, number of job in past 5 years and planning to change the job in next 5 years all these factors have impact on employees’ loyalty. According the result of the regression, independent variables like loyalty of the employer, gender, Number of jobs in past, the level of interesting job and highest level of education can be used for predicting employee loyalty. A salesperson, his job have to be interesting only then he will motivated. Proper management of company enhance salesperson enthusiasm towards jobs. Employer have to be enough loyal only then an employee can think himself or herself as a part of the company. Same goes for employer loyalty also. According to the model of employer loyalty, employee loyalty is the major factor. But all the factors which have impact on employee loyalty, is not significant for employer loyalty. These can be developed by the employers for retaining employees in the organization.
References
Kim, H.-Y., 2014. Analysis of variance (ANOVA) comparing means of more than two groups. Restorative Dentistry & Endodontics, 39(1), pp. 74-77.
Pandis, N., 2016. Multiple linear regression analysis. American Journal of Orthodontics and Dentofacial Orthopedics, Volume 149, p. 581.
Dahiru, T., 2008. P – Value, A True Test Of Statistical Significance? A Cautionary Note. Annals of Ibadan Postgraduate Medicine , 6(1), pp. 21-26.
Appendix
Method
Aim of the research
The primary aims and objectives that this study proposes to achieve are:
To determine and understand the effects of various factors on salesperson loyalty to the employer.
To determine and understand the effects of same factors on employer loyalty to the salesperson.
Study Design
The study was quantitative in nature. The project began with an exploratory phase and involved a thorough analysis of secondary data. All data has been collected through telephonic conversation. The design of the questionnaire is one of the most difficult and strategic work to do as it was done for collecting proper information. This experiment used a between-subjects design.
Procedure
After the collection of data, at first descriptive analysis was done to understand the data and visualizing it properly. Employee’s loyalty and employer’s loyalty both are dependent variable. For testing ANOVA, both are converted to continuous variable. First Anova was done for understanding significant difference in mean scores of the in employee loyalty based on demographics, length of employment etc. As gender is a categorical variable that’s why t-test has been done. For answering the second question, Once again, Anova was done to investigate the difference in mean scores of the in employee loyalty based on the perceptions of the employment conditions or overall satisfaction. For predicting salesperson’s loyalty, linear regression has been done with the selective factors which explained most of the model. For predicting employer’s loyalty also linear regression was performed for understanding the impact of those selective independent variables.
Figures
H0: Male and female do not differ in perceived employee loyalty
H1: Male and female differ in perceived employee loyalty


H0: No difference in means between employee loyalty and different demographics.
H1: At least one mean is different employee loyalty and different demographics.


H0: No difference in means between employee loyalty and different employment conditions

H1: At least one mean is different employee loyalty and different employment conditions






Looking for further insights on Assessing Anxiety Levels in Patients Attending Radiography Departments? Click here.
- 24/7 Customer Support
- 100% Customer Satisfaction
- No Privacy Violation
- Quick Services
- Subject Experts


