Comparative Analysis of Share Prices Before and After Crisis Across Different Country Types
Large developed country (UK)
Before crisis
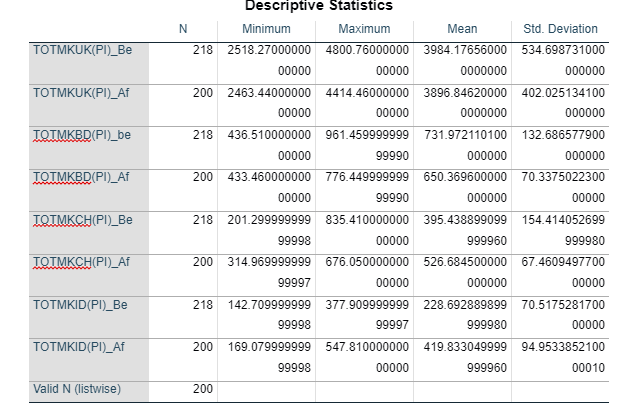
According to the UK share price of before crisis, the mean and standard deviation are 3984.17656 and 534.698731 respectively. If you need assistance with analysing these figures, you might consider seeking UK dissertation help. Minimum and maximum price 2518.27 and 4800.76 respectively.
After crisis
According to the UK share price of after crisis, the mean and standard deviation are 3896.8462 and 402.0251341 respectively. Minimum and maximum price 2463.44 and 4414.46 respectively.
Small developed country (Germany)

Before crisis
According to the Germany share price of before crisis, the mean and standard deviation are 731.9721 and 132.6865779 respectively. Minimum and maximum price 436.51 and 961.4590 respectively.
After crisis
According to the Germany share price of after crisis, the mean and standard deviation are 650.3696 and 70.33750223 respectively. Minimum and maximum price 433.46 and 776.45 respectively.
Large developing country (China)
Before crisis
According to the China share price of before crisis, the mean and standard deviation are 395.4389 and 154.4140 respectively. Minimum and maximum price 201.290 and 835.41 respectively.
After crisis
According to the China share price of after crisis, the mean and standard deviation are 526.68450 and 67.46095 respectively. Minimum and maximum price 314.970 and 676.050 respectively.
Small Developing country (Indonesia)
Before crisis
According to the Indonesia share price of before crisis, the mean and standard deviation are 228.6929 and 70.5175 respectively. Minimum and maximum price 142.70 and 377.90 respectively.
After crisis
According to the Indonesia share price of after crisis, the mean and standard deviation are 419.83 and 94.95338521 respectively. Minimum and maximum price 169.08 and 547.81 respectively.
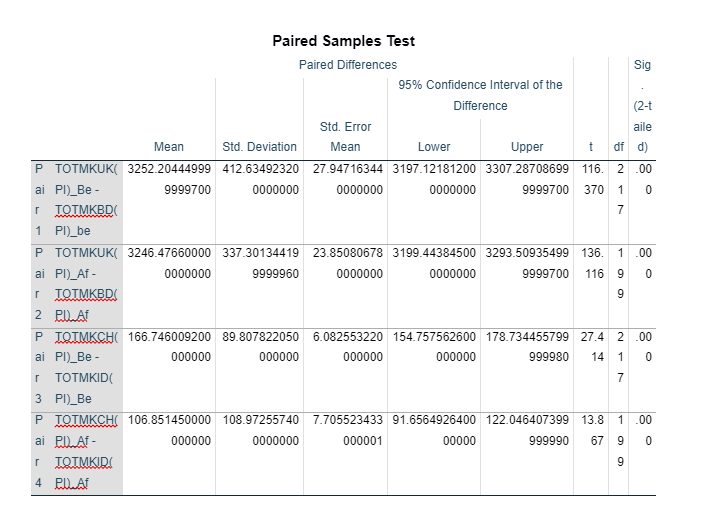
For comparing the share price of small vs large developed country and small vs large developing the appropriate statistical test will be an independent sample t-test as paired samples t-test relates the means between two unrelated groups in the context of same continuous, dependent variable.
Large developed vs small developed before crisis
According to the result of paired sample test , the associated p-value or significant value of t-test of equality of mean is 0.000 which are less than significance level 0.05 (figure 2). So null hypothesis is rejected which depicted that there is significant difference between the share prices of large developed vs small developed before crisis.
Large developed vs small developed after crisis
According to the result of paired sample test , the associated p-value or significant value of t-test of equality of mean is 0.000 which are less than significance level 0.05 (figure 2). So null hypothesis is rejected which depicted that there is significant difference between the share prices of large developed vs small developed before crisis.
Large developing vs small developing before crisis
According to the result of paired sample test , the associated p-value or significant value of t-test of equality of mean is 0.000 which are less than significance level 0.05 (figure 2). So null hypothesis is rejected which depicted that there is significant difference between the share prices of large developing vs small developing before crisis.
Large developing vs small developing after crisis
According to the result of paired sample test , the associated p-value or significant value of t-test of equality of mean is 0.000 which are less than significance level 0.05 (figure 2). So null hypothesis is rejected which depicted that there is significant difference between the share prices of large developing vs small developing before crisis.
January effect of Small (Germany) vs Large (UK) developed country
Small developed country (Germany) (L)
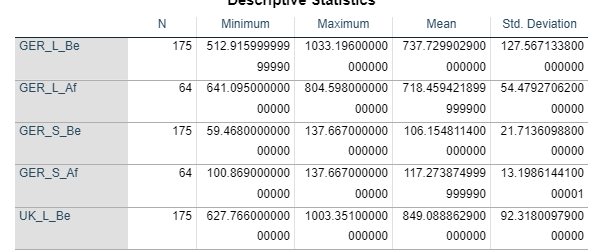
According to the Germany share price of before crisis, the mean and standard deviation are 650.3696 and 70.33750223 respectively. Minimum and maximum price 512.91599999999990 and 1033.19600000000000 respectively.
According to the Germany share price of after crisis, the mean and standard deviation are 718.459421899999900 and 54.479270620000000 respectively. Minimum and maximum price 641.09500000000000 and 804.59800000000000 respectively.
Small developed country (Germany) (S)
According to the Germany share price of before crisis, the mean and standard deviation are 106.154811400000000 and 21.713609880000000 respectively. Minimum and maximum price 59.468000000000000 and 137.66700000000000 respectively.
According to the Germany share price of after crisis, the mean and standard deviation are 117.273874999999990 and 13.198614410000001 respectively. Minimum and maximum price 100.86900000000000 and 137.66700000000000 respectively.
Large developed country (UK) (L)
According to the UK share price of before crisis, the mean and standard deviation are 849.088862900000000 and 92.318009790000000 respectively. Minimum and maximum price 627.76600000000000 and 1003.35100000000000respectively.
According to the UK share price of after crisis, the mean and standard deviation are 865.441484399999900 and 31.579397430000000 respectively. Minimum and maximum price 789.61399999999990 and 914.87899999999990 respectively.
Large developed country (UK) (S)
According to the UK share price of before crisis, the mean and standard deviation are 189.897325699999980 and 35.387347350000000 respectively. Minimum and maximum price 114.80900 000000000 and 238.73299999999998 respectively.
According to the UK share price of after crisis, the mean and standard deviation are 205.857515600000000 and 19.417670190000000 respectively. Minimum and maximum price 178.47500000000000 and 232.89300000000000 respectively.
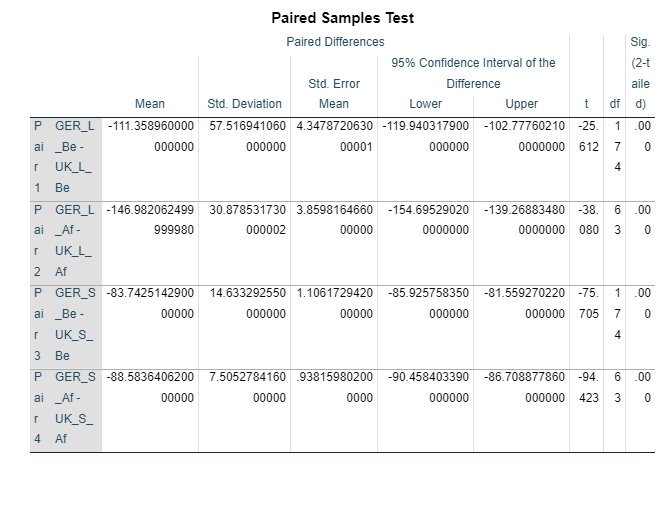
For comparing the share price of small vs large developed country the appropriate statistical test will be an independent sample t-test as paired samples t-test relates the means between two unrelated groups in the context of same continuous, dependent variable.
Large developed vs small developed before crisis (L)
According to the result of paired sample test , the associated p-value or significant value of t-test of equality of mean is 0.000 which are less than significance level 0.05 (figure 4). So null hypothesis is rejected which depicted that there is significant difference between the share prices of large developed vs small developed before crisis.
Large developed vs small developed after crisis (L)
According to the result of paired sample test , the associated p-value or significant value of t-test of equality of mean is 0.000 which are less than significance level 0.05 (figure 4). So null hypothesis is rejected which depicted that there is significant difference between the share prices of large developed vs small developed after crisis.
Large developed vs small developed before crisis (S)
According to the result of paired sample test , the associated p-value or significant value of t-test of equality of mean is 0.000 which are less than significance level 0.05 (figure 4). So null hypothesis is rejected which depicted that there is significant difference between the share prices of large developed vs small developed before crisis.
Large developed vs small developed after crisis (S)
According to the result of paired sample test , the associated p-value or significant value of t-test of equality of mean is 0.000 which are less than significance level 0.05 (figure 4). So null hypothesis is rejected which depicted that there is significant difference between the share prices of large developed vs small developed after crisis.
January effect of Small (Indonesia) vs Large (China) developed country
Small Developing country (Indonesia) (L)
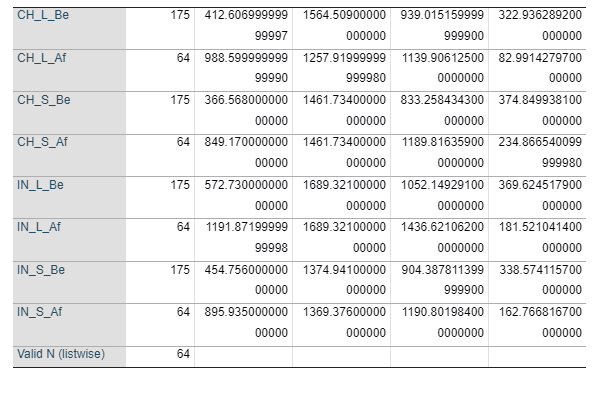
According to the Indonesia share price of before crisis, the mean and standard deviation are 1052.149291000000000 and 70.33750223 respectively. Minimum and maximum price 572.73000000000000 and 369.624517900000000 respectively.
According to the Indonesia share price of after crisis, the mean and standard deviation are 1436.621062000000000 and 181.521041400000000 respectively. Minimum and maximum price 1191.8719999999998 and 1689.3210000000000 respectively.
Small Developing country (Indonesia) (S)
According to the Indonesia share price of before crisis, the mean and standard deviation are 904.387811399999900 and 338.574115700000000 respectively. Minimum and maximum price 454.75600000000000 and 1374.94100000000000 respectively.
According to the Indonesia share price of after crisis, the mean and standard deviation are 1190.801984000000000 and 162.766816700000000 respectively. Minimum and maximum price 895.93500000000000 and 1369.37600000000000 respectively.
Large Developing country (CHINA) (L)
According to the CHINA share price of before crisis, the mean and standard deviation are 939.015159999999900 and 322.936289200000000 respectively. Minimum and maximum price 412.60699999999997 and 1564.50900000000000 respectively.
According to the CHINA share price of after crisis, the mean and standard deviation are 1139.906125000000000 and 82.991427970000000 respectively. Minimum and maximum price 988.59999999999990 and 1257.91999999999980 respectively.
Large Developing country (CHINA) (S)
According to the CHINA share price of before crisis, the mean and standard deviation are 833.258434300000000 and 374.849938100000000 respectively. Minimum and maximum price 366.56800000000000 and 1461.73400000000000 respectively.
According to the CHINA share price of after crisis, the mean and standard deviation are 1189.816359000000000 and 234.866540099999980 respectively. Minimum and maximum price 849.17000000000000 and 1461.73400000000000 respectively.
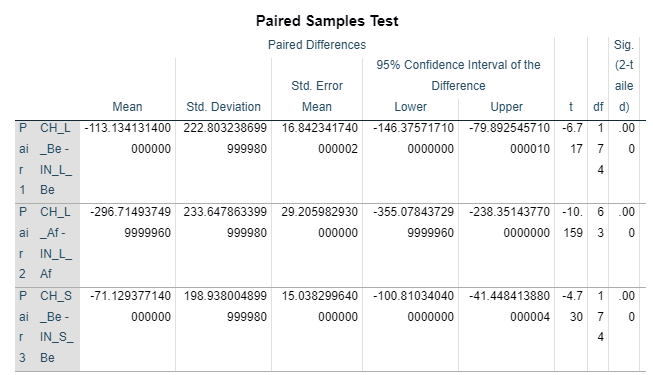
For comparing the share price of small vs large Developing country the appropriate statistical test will be an independent sample t-test as paired samples t-test relates the means between two unrelated groups in the context of same continuous, dependent variable.
Large Developing vs small Developing before crisis (L)
According to the result of paired sample test , the associated p-value or significant value of t-test of equality of mean is 0.000 which are less than significance level 0.05 (figure 6). So null hypothesis is rejected which depicted that there is significant difference between the share prices of large Developing vs small Developing before crisis.
Large Developing vs small Developing after crisis (L)

According to the result of paired sample test , the associated p-value or significant value of t-test of equality of mean is 0.000 which are less than significance level 0.05 (figure 6). So null hypothesis is rejected which depicted that there is significant difference between the share prices of large Developing vs small Developing after crisis.
Large Developing vs small Developing before crisis (S)
According to the result of paired sample test , the associated p-value or significant value of t-test of equality of mean is 0.000 which are less than significance level 0.05 (figure 6). So null hypothesis is rejected which depicted that there is significant difference between the share prices of large Developing vs small Developing before crisis.
Large Developing vs small Developing after crisis (S)
According to the result of paired sample test, the associated p-value or significant value of t-test of equality of mean is 0.980 which are greater than significance level 0.05 (figure 6). So null hypothesis is accepted which depicted that there is no significant difference between the share prices of large Developing vs small Developing after crisis.
Appendix



- 24/7 Customer Support
- 100% Customer Satisfaction
- No Privacy Violation
- Quick Services
- Subject Experts


