Integrative Marketing Campaign Report
SECTION ONE: EXPLORING THE DATA
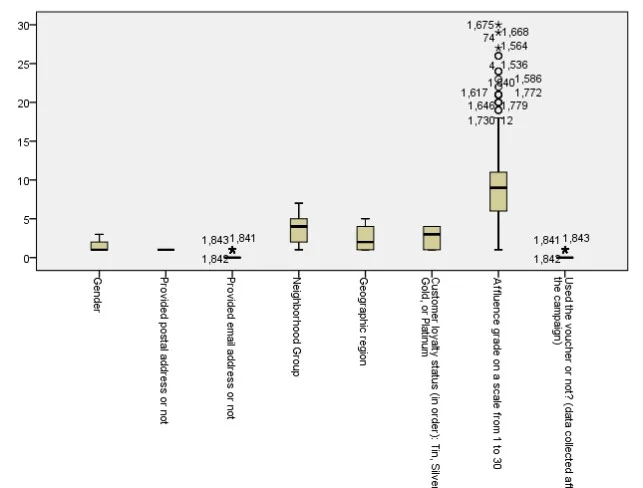
Using SPSS, the box plots and crosstabs for the categorical variables were created to tell the distribution of the data used. Excel was used for the case of profits, the continuous variable, to provide a summarised descriptive statistics table. For those needing additional support in their analysis, data analysis dissertation help can offer valuable insights and guidance throughout the process.
Descriptive Statistics

The descriptive statistics for the continuous variable, profit, indicate that out of the campaign, the total profits made were 15797.53 pounds. On the average, each contact provided the company with profits of 8.57 pounds. The standard deviation for profits was 20.22 pounds implying that the said profits were densely distributed around the mean.
Box Plot

The figure shows that only the affluence variable had the significant number of outliers. Other variables tend to be normally distributed around the mean

Crosstabs
Used the voucher or not? (data collected after the campaign) * Gender

Used the voucher or not? (data collected after the campaign) * Provided email address or not

only 108 customers providing the same. Also, a large number of those who did not use the voucher did not provide their email address. This is an implication that a campaign targeting those with email addresses could most likely fail or yield significantly small profits.

Used the voucher or not? (data collected after the campaign) * Neighbourhood Group

The majority of those at neighbouring group C had used the voucher with the least being in the unknown group. Therefore, group C should be at the top of the characteristics used to profile customers for a successful campaign.
Used the voucher or not? (data collected after the campaign) * Geographic Region

Midlands had used their vouchers. The South West region recorded the least number of the customers who used the voucher. The indication is that targeting the customers living in South East and Midlands will be a profitable undertaking.
Used the voucher or not? (data collected after the campaign) * Customer loyalty status (in order): Tin, Silver, Gold, or Platinum

the Platinum class. The table indicates that the Gold, Silver and Tin class are profitable targets if elevated levels of profits from the next campaign are to be realised.
Used the voucher or not? (data collected after the campaign) * Affluence grade on a scale from 1 to 30

The summary clearly shows that those with low levels of affluence, from 15 down to 1, were the most users of the voucher. Therefore, the indication is that the company could make more profits by targeting those at levels below 15 than above the same.
Pre-processing and Transformation
The predictive response model was developed using SPSS with the target variable being ‘RESPONSE' implying those customers who used the voucher. The input variables included gender, address, email, neighbouring group, region, class, and affluence level. Before the model was developed, the data was preprocessed and transformed using SPSS (the Transform function). Later, the transformed variables were used for the analysis.
Logistic Regression Results

The Nagelkerke R Square is 31.9% indicating that the model is not that great but on the overall is good. The Cox & Snell R Square of .214 implies that the predictive response model explains the probability of a positive response (Yes) from a customer as 21.4% or 0.214

significantly high at 80%. This is a further indication that the predictive response model is good.

SECTION THREE: CHOOSING CUSTOMERS FOR THE EXTENDED Campaign
This should be done using the model developed in the previous section. The target is 2,000 customers out of the 18,884 which is a sample of 10%. To obtain customers with a high probability of response, the model developed should be used to create the cumulative gains/lifts chart. In this case, we can create the cumulative response chart. In this case, SPSS (Direct Marketing function) can be used to create a cumulative response rate chart based on different customer profile characteristics. The particular steps to be followed, while using the model, to create the chart to be used to select customer are summarised as follows;
Step 1 – We calculate the ‘Log (p/1-p)' for each client.
Step 2 – We rank the customers based on the results of step 1 (Log (p/1-p)).
Step 3 – We calculate the logs of total responses for each cut-off point.
Step 4 – We finally create the response rate chart.
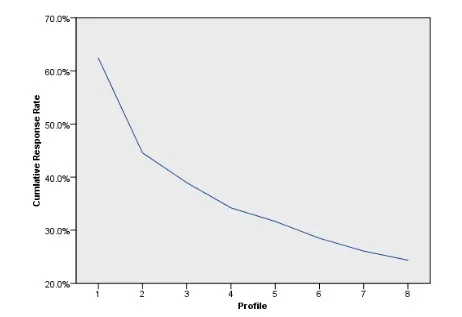
The chart created in step four will group the customers based on significant variables (profiles). In this case, the cumulative response rate chart for the campaign is shown below.

The chart shows the highest response rate to be just over 60% while the overall (lowest) is at just above 20%.
SECTION FOUR: THE EFFECTIVENESS OF THE THIRD CAMPAIGN (EMAIL MARKETING)
According to Benady (2014), marketing utilising the internet technology is cost-effective in the sense that a company can reach a large number of the targeted customers at a small cost. Therefore, emailing customers is a good alternative for the business under consideration (Schumann, et al., 2014). Despite the above, it is important to consider results from the analysed data.

To start with, the idea of using emails, at the moment is a good one. This is because the digital media channels are effective in reaching large numbers of customers at once (Schumann, et al., 2014). Apart from being cost-effective, the use of emails is also efficient and consumes less time as compared to using the post. That is, the time spent to reach an individual via email is significantly less as compared to doing the same by post. According to Mcclurg (2013), digital marketing provides a firm with the opportunity to increase marketing campaign effectiveness because it requires fewer resources as compared to other labour intensive methods. Despite the above, it is important to consider the current data a company has as regards to the targeted customers (Kerns, 2016). In the case that the clients' response rates as regards to those providing email addresses are small, then it is highly likely that the campaign will not be successful.
Based on the data analysis results, it is possible for the company to replace the post campaign with email campaign but this has many challenges. The reason is that there is a very low response rate as regards to those customers providing the company with their email addresses. The chart below shows the response rate under consideration;

The chart indicates that, based on the different customer profiles considered, the positive response rate for those clients who provided their email addresses ranges between 12.89% and 26.34%. Therefore, to run a successful campaign by email, the company needs to devise ways through which most of the customers respond positively as regards to providing their email addresses.
Based on observations as regards to the data provided, it is recommended that the company move on with conducting a campaign via email. The recommendations are supported by theory and research discussed above as regards to the advantages of media driven marketing. Consequently, by considering the customer profiles provided below, the company can select the various customers to contact via email and expect a response rate as high as 20% and as low as 12%.

to contact customers via email for the third company while targeting significant high response rates.
References
Benady, D., 2014. How technology is changing marketing. [Online]
Kerns, C., 2016. Trendology: building an advantage through data -driven real-time marketing. S.I.: Palgrave Macmillan.
Mcclurg, R., 2013. Digital Marketing is Key to Practice Growth: Making sense of SEO, PPC, DIY, DID, and social networking. Family Advocate, 35(3), pp. 28-30.
Schumann, J. H., Von Wangenheim, F. & Groene, N., 2014. Targeted online advertising: Using reciprocity appeals to increase acceptance among users of free web services. Journal of Marketing, 78(1), pp. 59-75.
Continue your exploration of Impact of Sports England Free Activity Sessions on Daily Step Counts with our related content.
- 24/7 Customer Support
- 100% Customer Satisfaction
- No Privacy Violation
- Quick Services
- Subject Experts


