The Dynamics of Britain's First EU Referendum
Introduction
David Butle and Uwe Kitzinger observed three main reasons behind the earlier vote of interest of Britain’s first referendum on its membership of the then European Community. They analysed the results and found that firstly, the majority of the voters, 67 percent to be exact wanted Britain to stay in the European Community. Secondly, according to their observation, there was a change in the established pattern of party competition, more specifically for the Labour Party. Thirdly, such kind of voting referendum event in Britain was a distinct innovation happening for the first time in the history of the nation (Baimbridge, 2016). The present study tries to answer the relative importance of factors such as age, education, immigration and ethnic diversity on the EU referendum and the difference in the pattern of public support between Brexit and Eurosceptic parties, especially the UK Independence Party (UKIP). For those seeking to delve deeper into the complexities of such topics, politics dissertation help can offer valuable insights and guidance.
Literature Review
On 5th June 1975, an innovative event took place as the Britain’s first referendum on its membership of the then European Community. After four decades and a year, on 23rd June 2016, a second referendum took place between Britain and its relationship with Europe. The results of the two referendums were quite contrasting. In the first referendum, there was a huge support for the pro-Europeans. However, the results of the later referendum were outlandish. In the referendum of 1975, 67 percent of the voters voted for Britain’s stay in the European. However, the scenario changed drastically in 2016 where 51.9 percent of the voters voted to leave the European Union (Baimbridge, 2016). That is, the leave vote margin was 3.8 percent higher than to remain vote, but in England region, this margin was as high as 7 percent. In the case of Wales, even after winning the first seat by UK Independence Party (UKIP) on the devolved Welsh Assembly, the leave vote secured 52.5 percent. The situations only differ in Scotland, Northern Ireland and London where the stay vote outpaced the leave vote. This result had a great impact on the financial market as because of it 3 trillion dollars were swept from the financial markets (O’Hara, 2016).

Like 1975, the tension between domestic party politics once again got limelight after the 2016 referendum. As a result of this 2016 referendum defeat, the Conservative Prime Minister who was in the seat since 2010, immediately resigned from the post. The effects of this result were also seen in other political parties also such as Jeremey Corbyn, leader of Labour Party that supported for campaigned to remain in, was also forced to resign. The other members of the Labour Party believed that Jeremey Corbyn failed to demonstrate leadership quality. In addition to this, they also felt that Jeremey Corbyn was not able to properly communicate the philosophy of the party to the Labour voters that Britain should remain in EU, as the poll results before the referendum shows that 50 percent of the Labour Party voters were unaware that the party was advocating for the stay for Britain in EU (Codjoe, 2016).
In such scenario, two parties that emerged as the unified parties towards pro-EU Liberal Democrats were UK Independence Party (UKIP) and Scottish National party. The UK Independence Party (UKIP) achieved its aim of withdrawing from EU after 23 years of its formation, whereas, Scottish National party reveals the need for the independence referendum in Scotland. The results of 2016 referendum are more challenging since most of the MPs are opposing the British constitutional settlement, so now Parliament needs to sustain a pro-Brexit policy (Codjoe, 2016). This can be seen from the fact that only 148 MPs in England and Wales voted to leave the EU as against 421 out of 574 constituencies in England and Wales. Specifically, Wales voted to leave EU while Scotland and Northern Ireland voted to remain in EU. Thus, there is a need to analyse the results of 2016 referendum thoroughly. The subsequent paragraphs will analyse the statistical significance of factors such as social class, age, immigration and ethnic diversity on the leave vote. In addition to this, the present pattern of support for Brexit will be mapped against the campaigns by Eurosceptic parties, such as UKIP (O’Hara, 2016).
Hypothesis
The present work is an attempt to analyse the result of the recent referendum. Thus, this work will analyse the impact of social class, age, immigration and ethnic diversity on the leave vote. Therefore, following is the null and alternative hypothesis for the given case:
Null Hypothesis
There is no statistical significance impact of the factors such as social class, age, immigration and ethnic diversity on the leave vote.
Alternative Hypothesis
There is statistical significance impact of the factors such as social class, age, immigration and ethnic diversity on the leave vote.
Data and Methodology
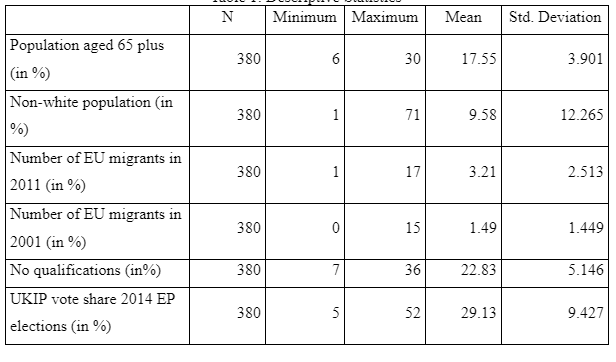
Data for any study can be collected from either primary sources or secondary sources. Primary sources are those sources which help in collecting fresh information. That is, through such sources, researcher collects data for the first time. On the other hand, secondary sources are those sources which provide data which has been already used in some earlier studies. That is, secondary data is not fresh data and has been used by earlier researchers in their work. Sources of primary data are an interview, survey, questionnaire, experiment, etc. on the other hand, sources of secondary data are books, journals, newspaper, websites, magazines, etc. In the present case, secondary data has been collected from data used by Goodwin and Heath for their study “The 2016 Referendum, Brexit and the Left Behind: An Aggregate-level Analysis of the Result.” Data has been collected for various parameters to analyse the significance of different predictor variables on the Leave vote which is the response variable. The main predictor variables that have been considered in this analysis are % age 65 and above, % no qualification, % EU migrants in 2001, % EU migrants in 2011, % non-white participants, London, Scotland and UKIP vote. The below table shows the descriptive characteristics of the predictor variables:

The above table shows the descriptive data for the 380 areas. The table presents minimum, maximum and average of each variable with its standard deviation. As per the data, the average population aged 65 plus years was 17.55 percent. Further, the average non-white population was 9.58 percent with a mean of 22.83 percent population with no qualification. The above table also shows that in 2001, the average percentage of EU migrants was 1.49 percent, which was increased to 3.21 percent in 2011. Finally, as per the above data, on an average, there was 29.13 percent of UKIP vote share in 2014 EP elections.
In order to analyse the impact of the above predictor variables of the leave variable, which is response variable, multiple regression will be performed. The results of multiple regression will show whether there exists a statistical significant relationship between the predictor variables and the response variable. In addition to this, scatter plot will be drawn between each individual predictor variable and the response variable to determine the linear relationship between the predictor and response variable. That is, the scatter plot will show whether there is a positive association or negative association between the response variable and the predictor variable.
Results
Scatter Plot

The above graph shows there is no strong association between the variables leave vote and percentage of the population aged 64 plus as the above scatter plot is highly scatted. However, the regression line between the two variables is upward sloping showing a positive relation between them; that is, as the percent of population aged 65 plus will increase more and more people will vote to leave.

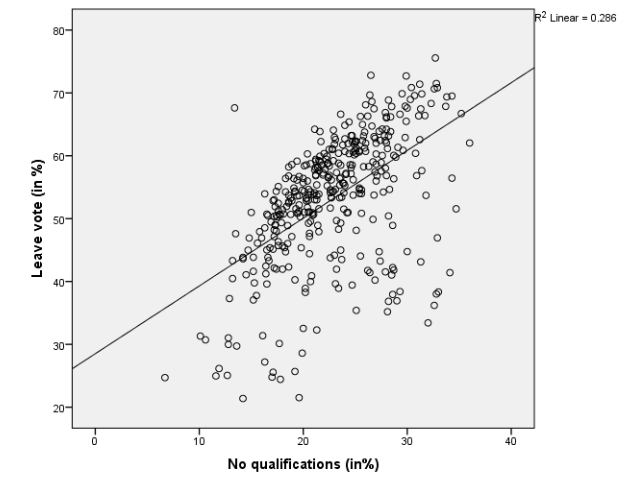
The above graph shows there is a strong association between the variables leave vote and percent of no qualification as the points in the above scatter plot are concentrated along a line. The regression line between the two variables is upward sloping showing a positive relation between them, that is, as the percent of no qualification will increase, more and more people will vote to leave.

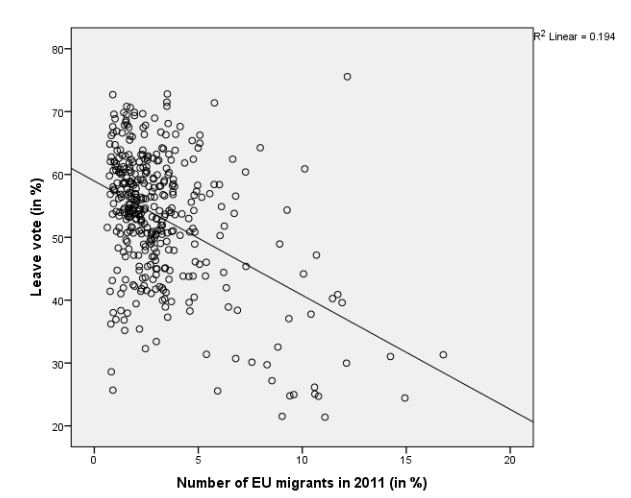
The above graph shows there is no strong association between the variables leave vote and number of EU migrants in 2011 as the above scatter plot is highly scatted. Further, the regression line between the two variables is downward sloping showing a negative relation between them; that is, as the percent of EU migrants will increase fewer people will vote to leave.

The above graph shows there is no strong association between the variables leave vote and percentage of EU migrants in 2001 as the above scatter plot is highly scatted. Further, the regression line between the two variables is downward sloping showing a negative relation between them; that is, as the percent of EU migrants will increase fewer people will vote to leave.

The above graph shows there is no strong association between the variables leave vote and percentage of the non-white population as the above scatter plot is highly scatted. Further, the regression line between the two variables is downward sloping showing a negative relation between them; that is, as the percent of the non-white population will increase fewer people will vote to leave.

The above graph shows there is a strong association between the variables leave vote and percentage of UKIP vote share 2014 EP elections as points in the above scatter plot are highly concentrated along a straight line. Further, the regression line between the two variables is upward sloping showing a positive relation between them; that is, as the percent of UKIP vote share 2014 EP elections will increase; more and more people will vote to leave.
Multiple Regression
Leave Vote as response variable


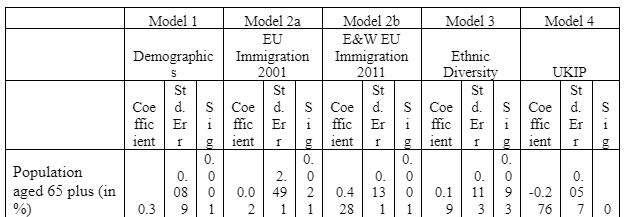
Model 1 shows that all the predictor variables had a significant impact on the response variable as the p-value of all the predictor variables is less than 0.05.
Model 2a shows that all the predictor variables had a significant impact on the response variable as the p-value of all the predictor variables is less than 0.05.
Model 2b shows that all the predictor variables had a significant impact on the response variable as the p-value of all the predictor variables is less than 0.05.
Model 3 shows that only Scotland, London and percent of no qualification had a significant impact on the response variable as the p value of these predictor variables is less than 0.05.
Model 4 shows that all the predictor variables had a significant impact on the response variable as the p value of all the predictor variables is less than 0.05.

UKIP Vote Share 2014 EP Elections as response variable

The above table shows that all the predictor variables had a significant impact on the response variable UKIP vote share 2014 EP elections as the p-value of all the predictor variables is less than 0.05.
Conclusion
Thus, from the above discussion, it can be said that age, education, immigration and ethnic diversity have statistically significant impact on the leave vote. The regression analysis shows that when all the predictor variables are considered simultaneously, each factor had a statistically significant impact on the predictor variables leave vote. Therefore, results of present study are in line with the study of Goodwin and Heath. Moreover, the regression model also shows that predictor variables such as that age, education, immigration and ethnic diversity also have statistically significant impact on the response variable UKIP vote share 2014 EP elections. Thus, the null hypothesis got rejected and alternate hypothesis got accepted.
References
Baimbridge, M. 2016. The 1975 Referendum on Europe - Volume 1: Reflections of the Participants. Andrews UK Limited.
Baimbridge, M. 2016. The 1975 Referendum on Europe - Volume 2: Current Analysis and Lessons for the Future. Andrews UK Limited.
Codjoe, E. S. F. 2016. The Great European Union Referendum Debate: Should the United Kingdom Remain a Member of the European Union or Leave the European Union?. AuthorHouse.
O’Hara, K. 2016. The Referendum Roundabout: The Referendum Roundabout. Andrews UK Limited.
Continue your exploration of The Department of Transports Investment Strategy with our related content.
- 24/7 Customer Support
- 100% Customer Satisfaction
- No Privacy Violation
- Quick Services
- Subject Experts


