Analyzing Macroeconomic Variables and Their Impact on Uk economy
Chapter 1 - Introduction
1.1: Overview
An economy is influenced by several micro and macro-economic factors. The macro-economic factors include GDP, real wage rate, inflation, the rate of foreign exchange, inflation rate and unemployment (Gough, 2013). While the macro-economic factors are related to the changes in the economy as a whole, micro-economic factors indicate at the micro changes. Micro-economic factors mainly involve customers buying behaviour and producers’ pricing and output tendencies. The different Market Structures that affect the functioning of a company also fall under Micro Economic Study, makes it an essential point to understand both micro and macro-economic concepts for effective economics dissertation help.
The present study discusses the different macro-economic variables that affect the UK economy. By explaining the concepts of ‘Stock Market Return’, the study proceeds on with an elaborative explanation. The stock market is an important factor deciding the fate of an economy (Eckett, 2015). While the economists are mainly worried about checking inflation and liquidity in a specific economy, the Market Watchdogs are concerned about the trends in the Stock Markets (Madura, 2008). The best indicator for determining the growth of an economy is its stock market as it is the major investment in any economy. Moreover, the stock market has its importance in decisions related to businesses also as the stock price can affect the amount of funds that can be raised through issues new shares to finance investment spending (Liow et al., 2006).

Market movement is speculative as no one can predict whether it is heading for a big kill or at a loss. At stock market, an investor can become either rich or poor within moments. Thus, before investing in share market, it is advisable for the investors to have complete knowledge about the trends in the market. A wise investor will always keep his or her portfolio diversified so as to minimize the risk and maximise the profits. The risk may be political, economic or social (Mazuruse, 2014).
It is not possible for an investor just to examine all the macroeconomic variables through daily analysis and monitoring, thus, it is essential to perform empirical research to identify which macroeconomic variable is responsible for the fluctuation in the stock market.
After the sub-prime crisis of 2008, the Bank of England has reduced its interest rate to 0.5 percent. The reason behind this was that the UK stock market was hugely affected due to crash down of Dow Jones Stock Exchange as both the markets are interconnected. Thus, the risk to one stock market will have an adverse impact on the other stock market. Such kind of risk is known as systemic risk (Leong and Hui, 2014).
Recently, the monetary policy committee of Bank of England set the interest rate at 0.5%. Moreover, the inflation was reported 0% in the report published by the office of national statistics. Further, the Bank of England sets monetary policy for maintaining currency value and an inflation rate which in turn helps in promoting the growth of the economy. Macroeconomic theories are concerned about the short-run stability of the economy and long-run growth rate. Thus, the proposed work makes an attempt to examine the long run and short run relationship between the macroeconomic variables and the UK stock market (Rjoub et. al., 2009).
1.2: Aim, Objectives and Research Questions
Aim
The main aim of the study is to determine the impact of the macroeconomic variable on the UK economy.
Objectives
- To determine the macroeconomic variables that affect the UK stock market
- To draw a relationship between the selected macroeconomic variables and FTSE 100 stock index for the period January 1986 to February 2016.
Research Questions
- What all macroeconomic variable affects the UK stock market?
- What is the relationship between macroeconomic variables and FTSE 100 stock index?
1.3: Significance of the Study
This study has lots of significance to the policymakers, economists, researchers and professors as it will help them in understanding how macroeconomics variables are related to the stock market and what impact this relationship has on the economy of the UK. Further, this study is also useful for safeguarding the traders and the investors.
1.4: Framework Analysis
Research Philosophy: The present work is based on positivism philosophy as the impact of macroeconomic variables will be similar on the economy of a nation around the world.
Research Design: This research is causal in nature as it analyzes the cause and effect relationship between the macroeconomic variables and the stock market return.
Research Type:The proposed work is quantitative in nature as the data collected is in quantitative form and thus quantitative data analysis technique of regression, correlation and descriptive analysis is applied.
Data Collection:Entire data collected for this research is secondary in nature and is collected from various government and officials sites to maintain validity and reliability of the data.
Data Analysis:Data is analyzed through SPSS by employing regression, correlation and descriptive analysis
1.5: Limitation of the Study
The major limitation of this paper is that all the data used for the analysis is collected from the secondary sources. Thus, validity and reliability of the data may be an issue. Collecting primary data was not possible as none of the officials from stock market will provide inside information to any of the external agency as it goes against professional ethical standards. Although all the data were collected from the authentic sources, still the data may have its impact on the outcome. Another limitation of the work is that the UK stock market used for this research is FTSE100 index of London Stock Exchange so there are possibilities that the findings of this report cannot be generalized with other stock market as the phase of the economy plays a huge role in such studies. The third limitation of this research work is that only four macroeconomic variables were taken into account in determining their relationship with the stock market return. The absence of other macroeconomic variables has affected the final findings of the work. Finally, time was a big constraint in the research process as due to limited time for the submission of the final report; the researcher was not able to include more macroeconomic variables in the study as collecting and analyzing such huge data requires considerable time and energy.
1.6: Structure of the Report
Chapter 1 - Introduction:The first chapter provides brief knowledge on the topic. It discusses aim and objectives of the study and highlights the significance and purpose of conducting the work. In addition to this, it also discusses the limitations of the study.
Chapter 2 - Literature Review: This is an important chapter of a research study and discusses various previous studies related to the topic under consideration. It is the best source for accumulating secondary data. By conducting a thorough literature review, a researcher can develop insight into the subject matter.
Chapter 3 - Research Methodology:For conducting any research study, a researcher needs to employ certain tools and techniques. These tools and techniques help the researcher to perform the study in a systematic manner. In this work also the researcher has defined certain methodologies that were used by the researcher during the entire research process.
Chapter 4 - Data Analysis: After accumulating data from the primary and secondary sources, the main challenge is to analyse the collected data. In this chapter, the researcher has analyzed the data collected from various secondary sources.
Chapter 5 - Conclusion and Recommendations:The final facts and findings drawn from the data analysis are presented in this section and on the basis of that conclusion are drawn. Further, as per the findings and conclusion, the researcher has made certain recommendations.
Chapter 2 - Literature Review
2.1: Introduction
Having discussed the elements of the Regression Equation, the study continues with the justification of the different factors by assessing their impact on the Stock Market Return. For this, the study will make use of the past literature and empirical findings that have found out some relevant outcomes related to the macro-economic factors used in the present investigation report.
2.2: Reviews of Previous Studies
In their studies, Homa and Jaffe (1971) and Hamburger and Kochin (1972) conducted research on the relationship between stock market return and money supply. Their study concluded that with the increase in money supply, there is an increase in equity prices. Further, Cooper (1974) and Rozeff (1974) demonstrated a causal relationship between money supply and stock price. They found that there us unidirectional relationship between money supply and stock price. However, the study of Rogalski and VInso contradicts the above studies as it found that there is a bi-directional relationship between money supply and stock price (Loo et al., 2016).
Hernadez (1999) performed Granger causality tests on 6 developed economies, namely; Canada, France, Germany, UK, United States and Japan to determine stock market efficiency and to gain information regarding the change in money supply and stock price. The study concluded that there was no causal relationship between past changes in the money supply and current changes in the stock price of France, Canada, Germany, UK and United States. However, in the case of Japan, change in money supply lead to a change in stock prices. The study conduct by Homa and Jaffe (1971) and Hamburger and Kochin (1972) are in line with that of Hernadez (1999). It also found that there was a unidirectional causality between the two variables (Leong and Hui, 2014).
As per the views of Minervini, (2013), in the UK, as in all other economy, the stock market is the biggest ‘unpredictable’ and ‘active’ sector. Investors invest in a company for an increase in capital funds, hence expansion of production. The companies try and attract the investors by announcing a ‘dividend policy’ that allures of paying a high dividend on the capital invested. This return which the investors gain by investing their capital in buying stock of the incumbent companies is referred to as the ‘stock market return’ (Connolly, 2010). Stock Market Return also includes the profits made by the investors by trading the stocks of that company. The aggregation of all type of returns gained by an investor by participating in the selling and buying of stocks is called the return on the stock market.
Now, the stock market being strong implies that the economy is in its ‘bull phase’. As stated by Ward, (2015), when a large number of investors keep their focus on buying and selling of share, the private sector of the economy expands, thereby resulting the whole of the UK economy to flourish. On the other hand, when investors drift away from the stock market, the companies witness lower sales and thus, reducing revenue and productivity of the UK economy as a whole. Thus, there is a shortage of funds in the stock market shortage of funds. This automatically compels the big companies to cut short their production. Return is a vital determinant of the UK economy (Mallick & Mohsin, 2010).
Interest Rate
As explained in Gough, (2013), when the UK Central Bank announces a hike in interest rate, the banks also follow the same. With the banks raising their lending rates, the companies had to postpone their plans for borrowing. The companies had to drop the plans for expansion. Thus, the complete private sector comes at a declining phase since most of the companies are unable to reap revenues in the absence of financial support (Minervini, 2013). This makes the stock market insecure. The investors shift their focus from Stock Market to Bonds Market, hence reducing the overall profit generated by the Stock Market. Interest Rate, commonly known as the Federal Rate, is the rate at which the Federal Reserve in the US agrees to lend capital to the banks. This interest rate directly affects the bank’s lending rates (Gürkaynak, et al., 2010).
Inflation Rate
The impact of inflation on the Stock Market is conflicting. The history and past market studies as in Eckett, (2015) reveal that inflation might have a positive or negative impact on the stock markets. This depends on consumer spending and the capacity of the UK Government to utilise Monetary Policy as a weapon. In most of the cases like that of Connolly, (2010), the data show that rising inflation makes the stock market highly volatile. With rising inflation, several investors tend to invest their capital in ‘high dividend yielding stocks’. They use such stocks so as to hedge against the surging inflation and price of inputs. The fact, however, remains that a persistent inflation will reduce the purchasing power of currency, hence declining company’s growth (Thomas, et al., 2010).
Hassan (2008) in his research studied the relationship between inflation and stock returns in the UK using vector correlation model and linear regression to explain Fisher hypothesis known as Fisher effect. The researcher found a positive and significant relationship between the two variables for the first method. In addition to this, co-integration test found a long run relationship between price levels, share prices and interest rates and this implies that macroeconomic variables are long-run determinants of stock returns in the UK. These findings were in line with that of Firth (1979) but contradict to the findings of Jaffe and Mandelker (1977) and Fama and Schwert (1977) (Thomas, et al., 2010).
Exchange Rate
Exchange rate as defined by Madura, (2008) refers to the rate at which two currencies are exchanged. Recently, the Eurozone has adopted ‘quantitative easing’ by printing paper money. This created the devaluation of the Euro with respect to US Dollar. This implies that the company could export more volume than before since exports will become more profitable with falling value of the home currency and that a rise in foreign currency (Barrell, et al., 2010). Companies being able to generate more international revenues, help in increasing the dividends per share. Finally, the dividends become valuable and more investors shift from the bonds market to the stock market.
In this series, Morley and Pentecost (2000) performed a study to draw a relationship between spot exchange rates of G7 countries, that is, (Canada, France, Germany, Italy, Japan, the UK, and the United States) and stock market return. They also conducted co-integration test on the monthly data collected between 1982 and 1994 and tested long run relationship between stock price and spot exchange rate. Their findings show that there is little correlation between stock prices and bilateral exchange rate. They also concluded that exchange rates and stock prices do not have common trends and the stock market returns of G7 countries are not influenced by the spot exchange rates and vice versa. Their findings are similar to the findings of Vanita and Khushboo (2015).
Aggarwal (1981) performed his study on US capital market and draw a relationship between stock price and exchange rates. In his study, he used floating exchange rates of the dollar between 1974 and 1978 and monthly stock prices of the market. Aggarwal found a significant positive relationship between the currency of US and the stock price. A study on BRICS countries performed by Vanita and Kushboo (2015) to determine the long run relationship between stock price and exchange rates and performed Johansen co-integration test on the data collected between 1997 and 2014 (Minervini, 2013). They concluded the significant negative relationship between the stock price of India, South Africa and Russia and exchange rate. Thus, their results were contradicted to the findings of Aggarwal (1981) (Gürkaynak, et al., 2010).
GDP
As per the views of Ward, (2015), a rising GDP is the foremost indicator of economic progress. A country that has falling trends in GDP can never assure of experiencing a good productivity or a strong stock market. A rising GDP implies an increase in company’s productivity and vice versa (Ward, 2015). A company’s productivity is positively related to rising in stock value (Li, et al., 2010). Thus, it can be concluded that an increase in the real GDP has a strong and positive influence on the stock market.
More than one Macro-economy variable
The study performed by Asprem (1989) examines the relationship between stock indices, asset portfolios and macroeconomic variables in ten European countries. He concluded that employment, imports, inflation and interest rates were inversely related to stock prices. In the case of Germany, the Netherlands, Switzerland and the UK, there was the strongest relationship between macroeconomic variables and the stock price. This means employment, imports, inflation and interest rates significant influence on stock indices and asset portfolio of Germany, Netherlands, Switzerland and the UK (Mallick & Mohsin, 2010). The study on Greek stock market by Dritsaki (2005) examined a long run relationship between the Greek stock market index of Athens stock exchange and industrial production, inflation and interest rates found that. The researcher applied Granger causality test and co-integration analysis on the quarterly data collected between 1989 and 2003 and found a significant causal relationship between the Athens stock exchange and selected macroeconomic variables.
A study performed on the US stock price index (S&P 500) by Ratanapakorn and Sharma (2007) to draw long term and short term relationship between the six macroeconomic variables between 1975 and 1999. The six macroeconomic variables used were the interest rate, money supply, industrial production, inflation and exchange rate. They found that in the long term, stock prices are negatively related to interest rates, but have a positive relationship with the money supply, inflation, exchange rate and industrial production. Their Granger causality test found that stock price is influenced by the macroeconomic variables in the long run but not in the short run (Leong and Hui, 2014).
A study of the influence of macroeconomic variables on stock prices of the US and Japan was performed by Humpe and Macmillan (2009) by using co-integration analysis. Their aim was to draw long run relationship between stock prices of the US and Japan and industrial production, consumer price index, money supply, long term interest rate. They found that industrial production is positively related to stock price and consumer price index, and interest rates are negatively related to the US stock prices. Further, there was an insignificant positive relationship between money supply and the US stock prices. In the case of Japan, there was positive relation between industrial production and stock prices, but negative relationship between money supply and stock exchange (Leong and Hui, 2014).
Forson and Janrattanagul (2014) in their work found long run equilibrium relationship between Thai stock exchange index and macroeconomic variables that are money supply (M2), consumer price index, interest rate and industrial production index. They employed Johansen co-integration test and vector error connection model. Further, the granger causality test was used by Yamamoto (1995) to draw the long run relationship between depending variable (Thai stock exchange) and independent variables (money supply (M2), consumer price index, interest rate and industrial production index. The study concluded that money supply showed a strong positive relationship whereas the industrial production index and customer price index both showed a negative long run relationship with Thai stock exchange index (Leong and Hui, 2014). They also found that there is a bi-direction relationship between money supply and industrial production whereas unidirectional between consumer price index and industrial production, industrial production and consumer price index, money supply and consumer price index, and consumer price index and Thai stock exchange index.
2.3: Arbitrage Pricing Theory
Ross (1976) proposed the APT (Arbitrage Pricing Theory) which is entirely opposite of CAPM (Capital Asset Pricing Model) as it only considers the market risk premium as the only risk factor. However, in the case of Arbitrage Pricing Mode, the theory several risky factors that affect the stock price apart from the stock market. Such factors include interest rate, inflation and other macroeconomic variables (Aras and Crowther, 2008).
Although Arbitrage Pricing Theory has certain limitations, it offers several advantages to the investors such as it provide investors an opportunity to considered all the risky factors while deriving the required rate of return for a particular firm. Not only the market conditions influence the sensitivity of the asset, but industrial conditions also have their impact on the sensitivity of the asset. Thus, investors and traders can also consider both the factors which can be responsible for affecting the required rate of return (Sornette, 2009).
Thus, from the literature review, it can be seen that different stock market behaved differently under the influence of various macroeconomic variables. Most of the studies concluded that most of the macroeconomic factors have some or the other effect on the stock price indices.
Chapter 3 - Research Methodology
3.1: Introduction
This section of research is the most important as it helps the researcher in collecting valid and reliable data and employing correct tools and techniques for data analysis. This chapter discusses various research methodologies from which the researcher can select the best methodology as per the nature of the study (Merriam, 2009).
3.2: Aim, Objectives and Research Questions
Aim
The main aim of the study is to determine the impact of the macroeconomic variable on the UK economy.
Objectives
- To determine the macroeconomic variables that affect the UK stock market
- To draw a relationship between the selected macroeconomic variables and FTSE 100 stock index for the period January 1986 to February 2016.
Research Questions
- What all macroeconomic variable affects the UK stock market?
- What is the relationship between macroeconomic variables and FTSE 100 stock index?
3.3: Research Design
This methodology helps the researcher in accumulating the valid and adequate amount of data. Research design can be explorative, descriptive, experimental or causal. Explorative research design in applied if there is a lack of information available on the topic and researcher is trying to explore some new field. On the other hand, the descriptive design is applied for describing the characteristic of a particular problem. Experimental design is that which is performed in labs under a controlled environment. Finally, to draw some cause and effect relationship, causal design is employed (Mulder and et. al., 2000). In the present case, since the researcher is drawing a relationship between macroeconomic variables and the economy of the UK, causal design is selected by the researcher.
3.4: Data Collection Method
Data can be collected from either primary data sources such as survey, interview, experiment, etc. or secondary data sources such as books, journals, internet sources, etc. In the present case, data are collected from external secondary sources. This is a secondary research where the researcher is solely based on secondary data gathered from the authentic bases (Suri and Clarke, 2009). The data are extracted from the past academic researches and scholarly articles. The absence of a primary survey made the researcher depend on the data gathered from such secondary sources. Accessing to the Websites of World Bank and Office for National Statistics, the researcher made the bulk portion of data collection (Gill and Johnson, 2002).
3.4.1: Type (Choice) of Data Collected
The research is based on secondary data collected from external sources. Relevant information on Interest Rate, Rate of Inflation, Exchange Rate and GDP are gathered from World Bank, Statista, Europa and UK.Gov. The choice of secondary data is made because the macroeconomic factors cannot be gathered from primary surveys within a short period of time. After collecting the secondary data from the mentioned websites, the researcher will use tables and charts to analyse the data and obtain some valuable findings (Golafshani, 2003).
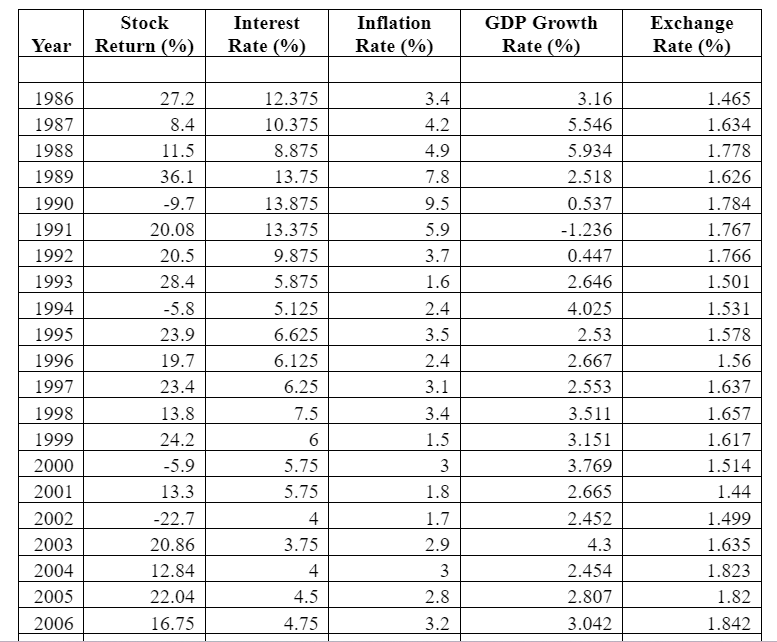
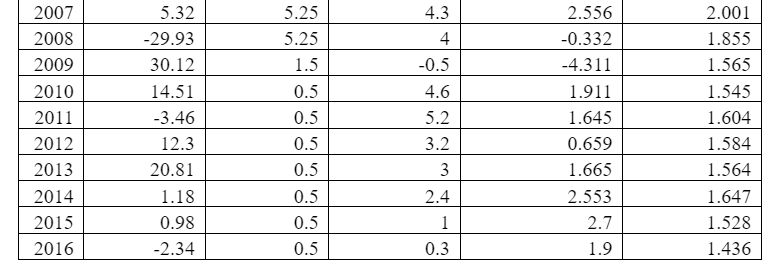
3.4.2: Secondary Data Collected
Data on Interest Rate in the UK are derived from the World Bank website over the period 1986-2016. The data reveal that the UK interest rates have long been lying below the average hike. According to Marc Carney, the Bank of England is not likely to raise the interest rates due to the unstable market position. With falling price of crude oil and fluctuating inflation rates, the Bank of England tends to keep its interest rate at a 0.5 % of the Bank Rate of lending (Leong and Hui, 2014).
The rate of Inflation is measured by the Consumer Price Index. The ability of a consumer to purchase a basket at the same price in the current year compared to the previous year hints at the rising costs of essential commodities. The impact of changing inflation rates on the Stock Market Returns is a debated topic. While in some period, there has been a high return on stock markets with increasing inflation rates, in remaining periods the reverse was also true. Exchange Rate refers to the currency valuation of one currency with respect to another (Leong and Hui, 2014).

Finally, data on GDP growth rate were extracted from the Office for National Statistics and World Bank. GDP is by far the most important indicator for investing in stock markets. When an economy shows signs of improvement, as evident from the GDP rates, the investors are more attracted to invest in the company’s shares. Falling GDP implies investors growing interest on secured government bonds that could yield higher benefits at times of volatile economic conditions (Mazuruse, 2014).
Additional data on UK GDP are derived from the Website of Office for National Statistics, in real amount. The data highlight the fact that the economy has successfully stabilised its position by increasing the Gross Domestic Product since 2013. The GDP in the second quarter of 2014 reveal that the country has achieved a GDP as high as 390 billion euro which is the benchmark growth similar to that of the pre-crisis economy phase (Mazuruse, 2014).
3.5: Data Analysis
After collecting the data from the authentic websites and journals, the researcher utilises some specific tools of analysis. The data on the following variables will be subjected to analysis-
Stock Market Return for 30 years, Interest Rates, Exchange Rates, GDP (change and amount) and rate of Inflation were considered while analysing the relationship between these and the Stock Market Return (Haimes, 2002). The SPSS software was used to conduct a ‘multiple regression analyses. The inbuilt features of SPSS helped the researcher to check how and to what extent the variables are effective in explaining the change on Stock Market Return. A simple test of Correlation was also carried out to check the influence of the independent variables on the dependent variable (Babbie, 2010).
The given regression equation as stated above is,
SR = α + B1 Interest Rate + B2 Inflation + B3 Exchange Rate + B4 GDP + B5 + e residual
- Where, SR- stock market returns
- B1, B2, B3…- coefficient of the independent variables
- e- Residual constant
Here, the regression equation indicates the role of interest rates, inflation rates, exchanges rates and GDP in explaining the impact over the dependent variable, which is the return on stock markets, SR. The B1, B2, B3…, are the slope coefficients and can be considered as fixed proportions of change for a particular explanatory variable.
3.6: Research Validity and Reliability
In order to reach to certain authenticate findings, it is essential for the researcher to maintain the validity and reliability of the data. The creditability of the research highly depends on the validity of the data collected. Validity can be defined as acquiring or extracting information from the reliable source so that the final results lead towards an exact solution to a given problem. If the research is valid and reliable, its final outcome will have safety and uniformity. In the present case, since the data collected is secondary in nature, the researcher had tried to maintain the validity and reliability of the data by collecting it through some reliable sources. All the data have been collected from either government of official websites to maintain its validity (Gibaldi, 2010).
3.7: Summarising the Key Issues
The key issues while collecting the data are mainly related to data accessing and data analysis. Accessing the data from secondary sources means that the researcher could face accessibility constraints. The authentic websites often require personal subscription and personal login addresses. Such additional requirements make the data collection technique bit confusing and time-consuming. The major advantage of carrying out a secondary research is that the researcher takes lesser time to gather and analyse the data. The disadvantage of secondary analysis is that the findings are less convincing as the researcher is not directly involved with data collection. Chances of data manipulation, data duplicity and data loss remain in secondary research techniques. To minimise such disadvantages, only authentic websites such as World Bank and Office for National Statistics were accessed (Ethridge, 2004).
Chapter 4 - Data Analysis
4.1: Introduction
This is the core section of the secondary research where the data on the five variables will be subjected to quantitative statistical analysis. Using the SPSS software, the data on last 30 years will be considered for analysis and discussion. The most commonly used statistical tests such as the Test of Correlation, regression and the descriptive statistics were executed, and the outcomes were assessed to identify the significance of all the four macro-economic factors. The data sets are attached in the Appendix to reduce interpretation complexities.
4.2: Descriptive Statistic
The study makes use of descriptive statistical tests to describe the nature of the chosen variables. The results of detailed descriptive tests are attached at the Appendix. Only the vital features of the chosen variables are discussed in this particular section.
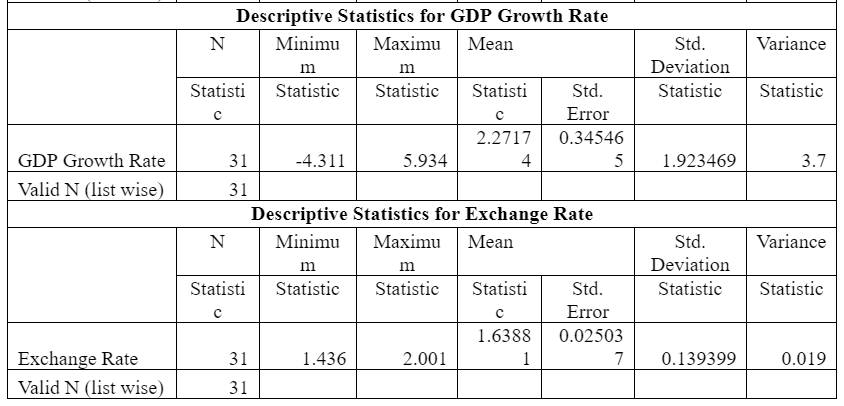
Table 1: Descriptive Statistics of Macroeconomic Variables

4.2.1: Stock Return
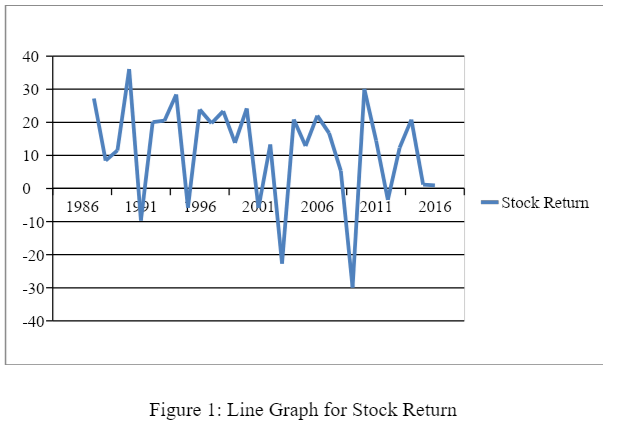
Figure 1: Line Graph for Stock Return
The line graph of stock return is quite fluctuating and many times it has gone even negative in the last three decades. This show, even the developed countries like the UK are susceptible to the macro and micro factors of the economy. Further, the descriptive statistics shows that the maximum return delivered by the stock exchange is 36.10 percent which is quite a handsome amount. On the other hand, the minimum return delivered by the UK stock exchange is negative 29.93 percent. The market delivered such poor returns in 2008, that is, at the time of sub-prime crisis. Finally, the standard deviation statistic shows a deviation of 15.4 percent which is quite a huge and shows depicts the fluctuating behaviour of the UK stock exchange with an average mean of 11.23 percent. Valid N shows a number of valid observations on the basis of which all the calculations are done.4.2.2: Inflation Rate
From the descriptive test results of Inflation rate, it can be said that the mean inflation rate was around 3.329% % (see figure 2). The maximum inflation was recorded in 1991 when it reached the level of 9.5 percent. Whereas, the minimum inflation of -0.5 was recorded in 2010 when the market was recovering from negative effects of the sub-prime crisis and Bank of England decided to reduce the interest rate to 0.5 percent. This indicates at the presence of inflationary pressures within the economy. Standard variation result specifies that the mean value deviates from the middle value to an extent of 1.9887. This value is quite small, and it could, therefore, be said that the inflation rates over the years lied quite close to 3% (approx.). Valid N shows a number of valid observations on the basis of which all the calculations are done.
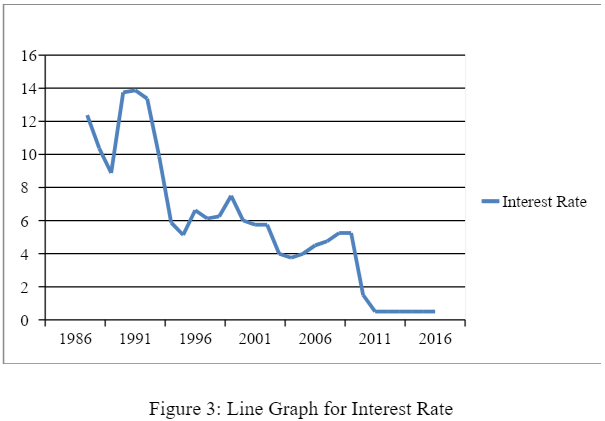
4.2.3: Interest Rate

Next, the descriptive tests on Interest Rates depict that the average interest rate maintained by the Bank of England is around 5.613 % (see figure 3). This indicates at the change in interest rates charged by the Central Bank. This rate is quite nominal. The interest rate was high during the financial crisis period. The UK government had to make use of monetary measures by increasing the lending rates. This was done to de-motivate the private firms to borrow money and squeeze out excess liquidity from the UK markets. The standard deviation of 4.117 is again a satisfactory result as it implies that the median value is almost very close to the average value. Valid N shows a number of valid observations on the basis of which all the calculations are done.
4.2.4: GDP Growth Rate
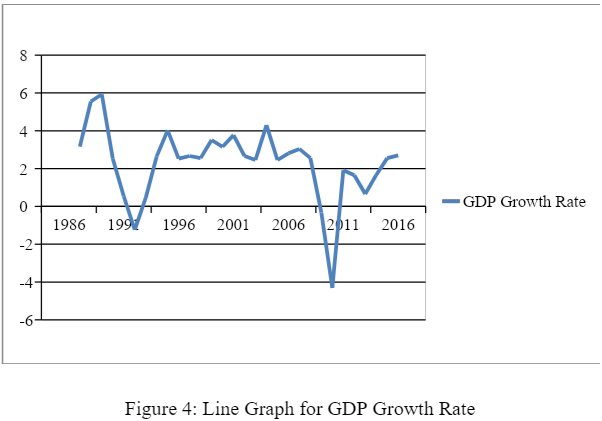
As per the descriptive test outcome, the Mean GDP growth rate of the UK economy is around 2.272 (see figure 4). This is the average change over the last 30 years, from the year 1986 to 2016. It has achieved its peak during 1988 and was slumped to negative 4.31 in 2010 after the sub-prime crisis. This shows that the GDP growth rate was neither too intense nor too poor. This stable growth rate in GDP is one of the unique features of the developed economies. This is visible in most of the OECD countries where real GDP, as well as per capita GDP growth rates, tend to remain more or less stable. Valid N shows a number of valid observations on the basis of which all the calculations are done.
4.2.5: Exchange Rate
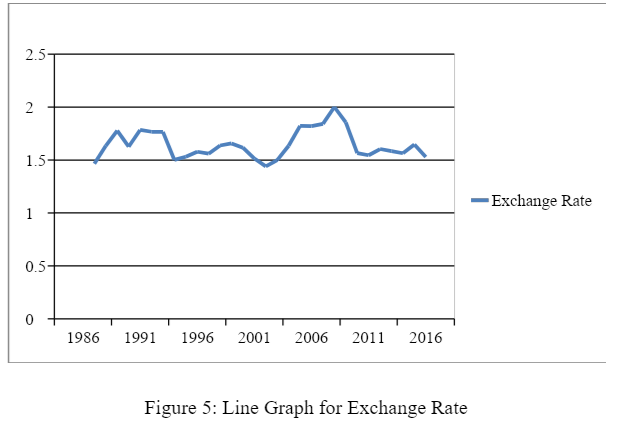
The descriptive tests on Exchange Rate reveal that the mean exchange rate in the UK was nearly 1.638 % (see figure 5). This implies that the average change in exchange rates of the UK economy was somewhat around 1.638 %. This change depicts the fact that the UK currency was not subjected to massive currency exchange rate fluctuations. This also highlights the stronger position of British Pounds compared to the other currencies that generally tend to suffer from fluctuating rates. The standard deviation value of showing the slight difference is also a proof of this fact. Valid N shows a number of valid observations on the basis of which all the calculations are done.
4.3: Correlation

Table 2 shows the correlation between all the variables considered in the study. According to the correlation table, there is a negative relationship between inflation rate and market return. Further, there is a positive relationship between market return and interest rate, negative relationship between market return and GDP and negative return between market returns and exchange rate.
4.4: Regression
The study begins with framing a ‘regression equation’ where the ‘stock market return’ is the dependent variable. The independent variables are Interest Rate, the rate of Inflation, Exchange Rate and Gross Domestic Product (GDP). Taking these as dependent and independent variables, the following Regression Equation is formed:
SR = α + B1 Interest Rate + B2 Inflation + B3 Exchange Rate + B4 GDP + B5…. + e
Here, SR stands for the ‘stock market return’ and α is the intercept of the regression line. e is the regression residual. A regression equation is a statistical mode of analysing the impact of independent variables on a dependent variable. Similarly, the four factors of interest rate, inflation rate, exchange rate and GDP are used to predict their impact on the ‘stock market return’.
All the variables entered in the regression model to determine the relationship between them are Stock Exchange is the dependent variable whereas; GDP, Growth Rate, Inflation Rate, Interest Rate and Exchange Rate are all independent macroeconomic variables. Finally, it also shows that 'Enter' method was applied in SPSS to determine the regression results.

Table 3 presents the final findings of the regression between the Stock Exchange which is the dependent variable and GDP, Growth Rate, Inflation Rate, Interest Rate and Exchange Rate, which are all independent macroeconomic variables. The correlation coefficient R comes out to be 0.339 which shows that there is a positive relationship between the stock market return and all the independent variables when taken together. That is, positive change in the independent variables taken together will have a negligible positive impact on the dependent variable. Further, the regression table shows that the regression coefficient R2 comes out to be 0.115 which is very small meaning that there is a very weak relation between the dependent variable Stock Market and independent variables Interest Rate, Inflation Rate, GDP and Exchange Rate when taken together. Moreover, the F value, which shows decides the significance level is coming out to be 0.511, it means that there is insignificance relationship between the dependent variable stock market and independent variable Interest Rate, Inflation Rate, GDP and Exchange Rate when taken together. It is so because many other macroeconomic variables such as consumer price index, the balance of trade, unemployment, government budget balance, labour productivity, etc. which have influence in evaluating the value of stock return were absent in the model. The later part of this analysis will try to establish a relationship between the dependent variable and independent variables individually. Table 7 also provides the coefficient summary based on the regression and on the basis of this, regression equation can be formulated as below:
SR = 22.482 - 2.262 Inflation Rate + 1.588 Interest Rate - 0.494 GDP Growth Rate - 7.021 Exchange Rate
Chapter 5 - Conclusion and Recomendations
5.1: Conclusion
This paper investigates the impact of four selected macroeconomic variables on the UK stock market. The UK stock market selected for this study was FTSE100 index. The study concludes that even the developed countries like the UK are susceptible to the macro and micro factors of the economy. The descriptive statistics shows that the maximum return delivered by the stock exchange is 36.10 percent which is quite a handsome amount. On the other hand, the minimum return delivered by the UK stock exchange is negative 29.93 percent. The market delivered such poor returns in 2008, that is, at the time of sub-prime crisis. The study also indicates the presence of inflationary pressures within the economy.
Further, it was found that interest rate is quite nominal. The interest rate was high during the financial crisis period. The UK government had to make use of monetary measures by increasing the lending rates. This was done to de-motivate the private firms to borrow money and squeeze out excess liquidity from the UK markets. The study also found that the GDP growth rate of the UK was neither too intense nor too poor. This stable growth rate in GDP is one of the unique features of the developed economies. This is visible in most of the OECD countries where real GDP, as well as per capita GDP growth rates, tend to remain more or less stable. Finally, the descriptive statistics shows that the UK currency was not subjected to massive currency exchange rate fluctuations. This also highlights the stronger position of British Pounds compared to the other currencies that generally tend to suffer from fluctuating rates.
The regression model concludes that there is a positive relationship between the dependent variable, that is, stock return and independent variables such as GDP Growth Rate, Inflation Rate, Interest Rate and Exchange Rate and correlation coefficient comes out to be 0.339. Further, the regression analysis shows that the regression coefficient R2 comes out to be 0.115 which is small meaning that there is a weak relation between the dependent variable Stock Market and independent variables Interest Rate, Inflation Rate, GDP and Exchange Rate when taken together, with a regression coefficient of 0.115. Moreover, the F value, which shows decides the significance level is coming out to be 0.511, it means that there is insignificance relationship between the dependent variable stock market and independent variable Interest Rate, Inflation Rate, GDP and Exchange Rate when taken together. It is so because many other macroeconomic variables such as consumer price index, balance of trade, unemployment, government budget balance, labour productivity, etc. which have influence in evaluating the value of stock return were absent in the model. The regression equation generated on the basis of the analysis is as follows:
SR = 22.482 - 2.262 Inflation Rate + 1.588 Interest Rate - 0.494 GDP Growth Rate - 7.021 Exchange Rate
Finally, according to the correlation table, there is a negative relationship between inflation rate and market return. Further, there is a positive relationship between market return and interest rate, negative relationship between market return and GDP and negative return between market returns and exchange rate. Thus, the findings of the study are contradicts to the findings of Vanita and Kushboo (2015), Hassan (2008), Firth (1979) and Asprem (1969). All these studies found significant relationship between macroeconomic variable and stock return. However, the present study is in line with the studies of Jaffe and mandelker (1977) and Fama and Schwert (1977) as both these studies also concluded insignificant relationship between the stock return and macroeconomic variables.
5.2: Recommendations
Based on the conclusion it can be said that macroeconomic variables, when taken together, do affects the stock market return and, in turn, the economy of the UK but not in a significant manner. Thus, it is recommended that conduct a research study using other macroeconomic variables also which are not included in the current table. These macroeconomic variables can be studied together or individually. Macroeconomic variables such as export price, oil price, import price, foreign exchange reserves, UK government debt should be studied in the future research and their impact on the FTSE 100 index must be reported. All the mentioned variables are related to international trade and may have a tremendous impact on the UK FTSE 100 index and may slow the rate of investment in the UK.
Oil price may be good variable to be considered as inflation will have its impact on the rise in oil price, and this may result in economic melt-down in the UK. Further, by considering government debt, the government can determine how much spending cuts can be implemented to match the deficit. Moreover, import and export are important economy indicator as they tremendously contribute to the economic growth of the UK since UK imports and exports from various other countries of the world.
Investors and traders generally avoid investing in such stock market which is highly influenced by the macroeconomic variables. Thus, they practice hedging to mitigate the risk and study the impact of macroeconomic variables on the FTSE 100 stock market in long run. Investor tries to reduce risk by diversifying their investments. Moreover, it is recommended that investors should refer all the publically available information before investing in any of the stock or markets.
It is also recommended that policymakers should also consider interest rate while formulating monitory policy. At the moment, interest rates are low in the UK, thus, it will benefit the country in the short run. However, in the long run, it can prove harmful for the UK economy as low-interest rate may cause inflation to rise.
Reflective Statement
The entire journey of the research process was a great learning experience. At various stages of the research process, I learnt the significance of various research tools and techniques. Through this work, I have got a deep insight into the impact of macroeconomic variables on the stock returns. The most challenging task for me during the research process was a collection of data. There was no authentic primary source for collecting the data, so I had to limit myself to collecting secondary data through various reliable online sources. Apart from this, since I was dealing with four independent variables and a dependent variable, so collecting and analyzing data for thirty years was also a challenging task. Another learning aspect of this project was the use of SPSS tool. Prior to this project, I had limited knowledge regarding analyzing data in SPSS. This research work has helped me in gaining sufficient knowledge for analyzing data in SPSS. Thus, overall it was a great learning experience, and now I am confident enough to conduct more research studies independently in future.
References
- Aras, G. and Crowther, D. 2008. Culture and Corporate Governance. SRRNet.
- Babbie, R. E., (2010). The Practice of Social Research. 12th ed. Cengage Learning.
- Barrell, R., FitzGerald, J. & Riley, R., 2010. EU enlargement and migration: Assessing the macroeconomic impacts. JCMS: Journal of Common Market Studie. 48(2). pp.373-395.
- Connolly, D., 2010. The UK Trader's Bible: The Complete Guide to Trading the UK Stock Market. 4th ed. London: Harriman House Limited.
- Eckett, S., 2015. The UK Stock Market Almanac 2016: Seasonality analysis and studies of market anomalies to give you an edge in the year ahead. 3rd ed. London: Harriman House Limited.
- Ethridge, D., (2004). Research methodology in applied economics: organizing, planning, and conducting economic research. 2nd ed. Wiley-Blackwell.
- Gibaldi, J., (2010). Handbook of Writers of Research Papers. 7th ed. Modern Language Association of India.
- Gill, J., and Johnson, P., (2002). Research Methods for Managers. 3rd ed. London: SAGE Publications Ltd.
- Golafshani, N., (2003). Understanding Reliability and Validity in Qualitative Research. The Qualitative Report. 8(4). pp.597-607.
- Gough, L., 2013. Financial Times Guide to how the stock market really works ePub eBook. 1st ed. Yorkshire: Pearson UK.
- Gürkaynak, R., Levin, A. & Swanson, E., 2010. DOES INFLATION TARGETING ANCHOR LONG‐RUN INFLATION EXPECTATIONS? EVIDENCE FROM THE US, UK, AND SWEDEN. Journal of the European Economic Association. 8(6). pp.1208-1242.
- Haimes, E., (2002). What can the Social Sciences Contribute to the Study of Ethics? Theoretical, Empirical and Substantive Considerations. Bioethics. 16(2). pp.89-113
- Leong, C. C. and Hui, K. T. 2014. Macroeconomic and Non-Macroeconomic Variables Linking to Singapore Hotel Stock Returns, in Joseph S. Chen (ed.) Advances in Hospitality and Leisure (Advances in Hospitality and Leisure, Volume 10) Emerald Group Publishing Limited. pp.21-36.
- Li, L., Narayan, P. & Zheng, X., 2010. Journal of international financial markets, institutions and money. An analysis of inflation and stock returns for the UK. 20(5). pp.519-532.
- Liow, H. K. et al., 2006. Macroeconomic risk influences on the property stock market. Journal of Property Investment & Finance. 24 (4) pp.295-323.
- Loo, K. W. et. al. 2016. Integration between the Asian REIT markets and macroeconomic variables. Journal of Property Investment & Finance. 34 (1). pp.68-82.
- Madura, J., 2008. Financial Institutions and Markets. Revised ed. London: Cengage Learning EMEA.
- Mallick, S. & Mohsin, M., 2010. On the real effects of inflation in open economies: theory and empirics. Empirical Economics. 39(3). pp.643-673.
- Mazuruse, P. 2014. Canonical correlation analysis: Macroeconomic variables versus stock returns. Journal of Financial Economic Policy. 6(2). pp.179-196.
- Merriam, B. S., (2009). Qualitative Research: A Guide to Design and Implementation. 3rd ed. John Wiley & Sons.
- Minervini, M., 2013. Trade Like a Stock Market Wizard: How to Achieve Super Performance in Stocks in Any Market. 4th ed. lONDON: McGraw Hill Professional.
- ONS, 2015. Consumer Price Inflation. [Online] Available at: http://www.ons.gov.uk/ons/rel/cpi/consumer-price-indices/december-2015/index.html [Accessed 25 January 2016].
- Rjoub, H. et. al., 2009. The effects of macroeconomic factors on stock returns: Istanbul Stock Market. Studies in Economics and Finance. 26 (1). pp.36-45.
- Sornette, D. 2009. Why Stock Markets Crash: Critical Events in Complex Financial Systems. Princeton University Press.
- Suri, H., and Clarke, D., (2009). Advancements in Research Synthesis Methods: From a Methdologically Inclusive Perspective. Review of Educational Research. 79(1). pp.395-430.
- Thomas, R., Hills, S. & Dimsdale, N., 2010. The UK recession in context—what do three centuries of data tell us?. Bank of England Quarterly Bulletin. 4(2). p.4.
- UKForex, 2015. Historical Exchange Rates. [Online] Available at: http://www.ukforex.co.uk/forex-tools/historical-rate-tools/historical-exchange- rates [Accessed 24 January 2016].
- Ward, R., 2015. Stock Market For Beginners UK book. 2nd ed. Briton: Robert Ward , ISBN 605041095X, 9786050410952.
- Worldbank, 2015. Data on Interest Rate. [Online] Available at: http://data.worldbank.org/indicator/FR.INR.RINR [Accessed 25 January 2016].
Appendix
Looking for further insights on Fostering Economic Growth? Click here.


- 24/7 Customer Support
- 100% Customer Satisfaction
- No Privacy Violation
- Quick Services
- Subject Experts