Fibres as Key Forensic Evidence
Introduction
Fibres play a critical role as trace evidence in solving complex crimes and support other evidence types used in the investigation pathway. Fibre analysis typically involves a microscopic comparison between known and unknown fibres samples[1], this can be laborious and requires a well equipped forensic laboratory with trained staff that may hamper operational team. In the past years, specific fibres type have been key evidence types in different crimes such as murder, homicide, and sexual assault worldwide. The most common fibre materials involved in crimes were cotton, Polyester, Polypropylene, Polycotton, Viscose, and Denim[2]. A rapid, sensitive, specific technique for fibre type confirmation at the crime science would prove useful to police, forensic and judicial services worldwide.
Identification of type of fibre is key in forensicanalyses of fibres. In addition, the identification of dye used within the textile provides a significant characteristic and information for the comparison and classification between dyed fibres[3]. Commonly, in the forensic examination of dyed fibres analysis extraction methods are used and combined with chromatographic or electrophoretic analysis for dye characterisation[4][5]. Also, HPLC applied for dye analysis of fibres in forensic science in casesfor single and mixture dye [6]. Alternatively, Vibrational spectroscopies, including Near-IR (NIR) spectroscopy technique is non-destructive, rapid analysis for dyed fibres without or less sample preparation needed. The NIR spectroscopy is an absorption technique which absorbs specific frequencies corresponding to its molecular overtone or combination vibrations[7].
Was-Gubala and Starczak [8] study the difference between Raman spectroscopy and Ultraviolet-visible microspectrophotometry for dyed Cotton and polyester fibres, which shows the power of spectroscopies to identify dyed mixtures and fibres without extraction. Refer to the literature, Raman and FTIR spectroscopies they are main techniques to provide the fibres nature and material in trace level, While MSP gives information on the dye [9][10][11][12][13][14][15]./p>
Near-infrared shows potential in different areas like the food industry, Polymer, Fuel and forensics [16]. Zhou et al. [17] investigate seven different fibres cotton, Tencel, wool, cashmere, polyethylene terephthalate (PET), polylactic acid (PLA) and polypropylene with NIR spectroscopy coupled with pattern recognition. The investigation shows that, NIR was able to differentiate between cotton, Tencel, PET, PLA, and PP, as demonstrated in PCA and SIMCA combined but confused in wool and cashmere, but with LDA as classifier model was able to differentiate between cashmere and wool.
A comparative investigation of NIR instruments (benchtops and portables) for Cotton fibres micronaire, two benches top FT-NIR was used (Bruker MPA and Buchi N-500), and Two Benchtop Dispersive NIR (Foss 6500 and Foss XDS), Portable AOTF NIR by Brimrose 5030 and Portable Dispersive NIR by Bruker Lancer. As per the investigation, portables more accessible, handy, and the results acceptable for demonstrating portable units, as well as fair to be used in the field [18]. Moreover, Rodgers et al.[19] Evaluate the portable NIR by a comparative study of three NIR portable unit (Bruker LancIR, Brimrose 5030 and JDS Uniphase) and Bruker MPA bench-top NIR. The study was of Cotton fibre micronaire, the instruments show rapid results, fast and no sample preparation needed. The NIR prediction in the study as the best overall is for the benchtop instrument, but the portables show a very good results compared to the bench top.
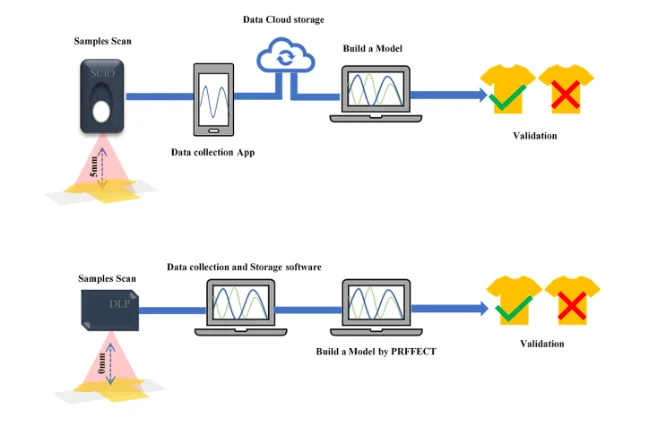
Portable Near-IR was investigated for forensic applications because it shows potential in-situ analysis fast, not expensive and non-destructive. One of the applications was Banknote analysis (comparison between authentic and counterfeit real banknotes) by Portable NIR coupled with PCA and partial least squares discriminant analysis (PLS-DA) which shows excellent results and high model performance [20]. NIR spectroscopic data needs to couple with chemo metric pre-processing and model for smoothing and noise reduction, PRFFECTv2.0.3 used. PRFFECT (https://github.com/Palmer-Lab/PRFFECT) is a free- user-friendly software package in R programming, recently released for spectral data pre-processing, classification models which utilise machine learning and its novel to be used for forensic classification purpose [7][8][21]. This study will investigate the feasibility of two near-infrared handheld spectrometers for identifying textile fibres in the crime scene for classification purpose of fibres evidence, as needed in forensic crimes scene instant comparison as recommended by review author [22]. The spectrometers are DLP microNIR miniature sensor (DLP) by Texas Instruments (www.ti.com) and SCiO® is made by Consumer Physics (https://www.consumerphysics.com/, SCiO). Both tools are non-destructive, scan the attenuated reflectance of the sample, low scanning time (few seconds), which will reduce the amount of time in casework. Moreover, no sample preparation needed for fibres (i.e. dye extraction), which make them suitable for direct comparison or analysis at the crime scene. The SCiO is a handheld NIR spectrometer, scan different kind of solids and liquid base samples, and have a wave number range of 700-1100 nm, which represents the third overtone in the NIR spectrum [7]. SCiO is used in different applications in forensics such as detection of counterfeit tablets [23] and instant detection of bloodstains in the crime scene [24]. The device is connected wirelessly to a mobile app called the lab via Bluetooth, atthe same time, the scans uploaded directly to the online build-in system cloud database. The cloud database enables the user to view the spectrum and create a suitable model. The DLP has a wave number of 1000-1700 nm, which represents the second overtone [8]. The DLP device is connected via USB wire to the PC to instant spectrum collection with DLP microNIR software version 2. Then, the user can easily export the data for further investigation and processing.

Materials and Methods
Materials
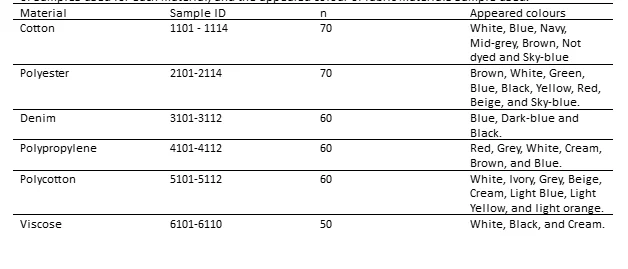
Most common fabrics materials are involved in crime scenes, used in the experiment with a total of seventy-four fabric samples. Six different fabrics materials with various colours and type are collected from multiple sources in the UK and Europe. Table 1 shows the dataset information used in this experiment. The information included fabric materials, colour and sample ID’s (created manually for experimental purpose) with a sequence of 2101, 2102, 2103, and go on. To the last sample number, each sample has an ID, the ID replicated with each sample scan. The first number of the ID represents the sample material, the last two digits represent the sample sequence and the second digit represents the experiment sequence which is this is the first experiment for this dataset used by the author.
Methods
2.1 Data Collection
Spectra collection of textile fabrics is performed by DLP micro NIR miniature and SCiO® NIR. Materials, placed in flat benchtop, with shade used for SCiO and the curtains were closed for DLP, to avoid any external light source. The SCiO sensor was kept 5 mm away from the sample while scanning, and the data controller by the SCiO Lab mobile App of iOS. The Attributes for fabrics samples data were sorted first by the Material, which is the mandatory attributes for the identification of each fabric, then colour, sample ID and manufacturer other comments shown in Table 1. DLP sensor was placed directly in touch with samples, as it’s recommended after some trials. The DLP system has one attribute which sits as fabric material, the data controlled by PC software. Five replicates for each sample (n = 74) taken for both sensors and 3 seconds scan delay for DLP. A total of 370 scan being performed for each sensor, minimal sample preparation and less than 2 min absorbance time for both sensors.
2.2 Data analysis
2.2.1 SCiO Consumer physics
The Data pre-processing and chemometric model made by using the online software of consumer physics ‘thelab’. The data pre-processing carried out in the build-in system after a few trails of different pre-processing methods to see the most accurate for the classification model.The cross-validation was made by the samples ID which been created to identify each sample by material, sample number, and experimental sequence, as it is the most very attribute. The Model is chosen for classification is random forest (RF) with Outlier detection, which gives a NULL response to unrecognised sample when testing the model. The Model has experimented with a target of sample Material as a build-in option in the online cloud.
2.2.2 DLP data pre-processing and analysis
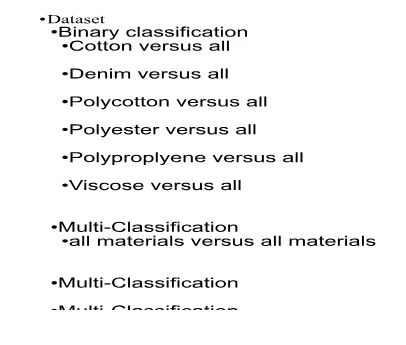
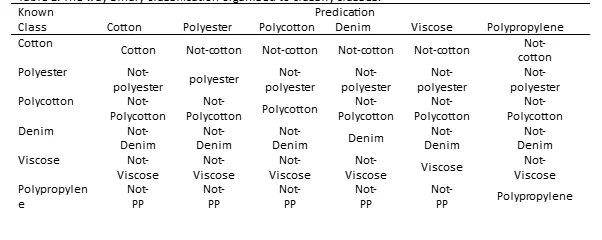
DLP nanoscanner data pre-processed and a model are constructed by using PRFFECT program in R programming software. PRFFECT is a free- user-friendly software package in R programming, recently released for spectral data pre-processing, classification models which utilise machine learningand its novel to be used for the forensic classification model. The program is divided the data into 70% training set and 30% testing set, which split as 15% internal and 15% external. The classification was done in binary basis one material class versus all as shown in table 2, and multiclassification of samples materials, which uses all data and classifythem according to the classifier model. Random forest model is selected to do the fabrics material classification in the model.
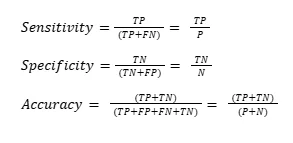
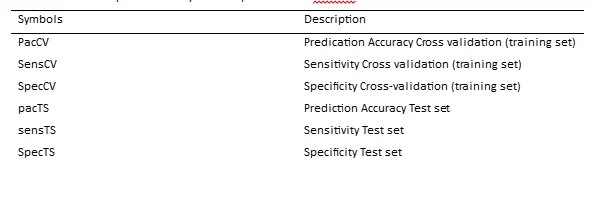
The program creates routinely Positive/Negative predictions of each classification for training data and test set cross-validations. The statistical metrics show the real predictions (actual positives and negative number) which represented by positives (P), negatives (N). Also, true positive (TP), true negative (TN), false positives ( FP) and false-negative (FN) as well as a statistical calculation of sensitivity, specificity, and accuracy, for in-depth classification analysis of each model and its reliability [25][26].
The software offers a build-in different data pre-processing methods, which are binning with various factors, Smoothing with unusual choices and parameters, different Normalisation methods, baseline corrections techniques, and EMSC. So, models were created with different pre-processing methods in the sequence of Binning, smoothing, normalisation, baseline correction, and EMSC, to investigate PRFFECT tool for fibres NIR data as shown in table 3 and 4.
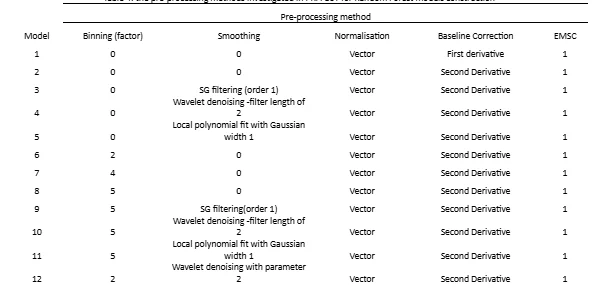
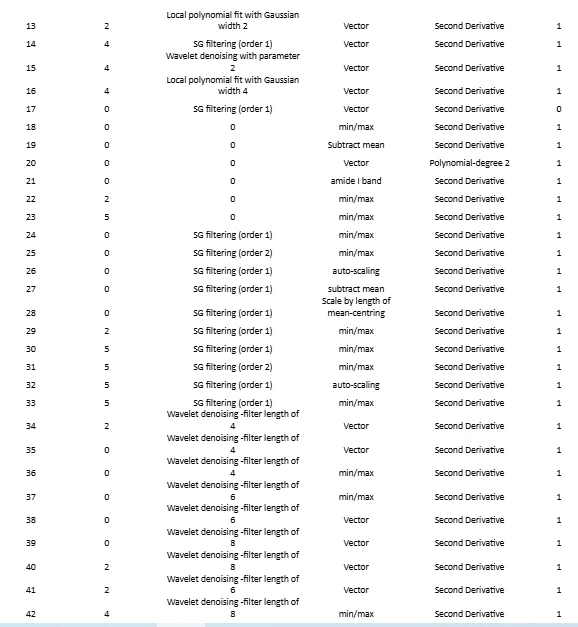
The best pre-processing method for RF model construction was used to create a PLS model to investigate another model for classification. The RF model creates Gini impurity of the features in the spectra.
3. Results and Discussion
3.1 SCiO Data and Model
Visually, the SCiO NIR sensorraw data spectrum representative of all the samples that did not show a distinction different between samples. The data has been investigated after a pre-processing method been used for the raw data to eliminate the overlappedsignals and scattering effects in spectra, as shown in fig 2. The short wavelength of SCiO sensor (740nm – 1070nm) represents the third overtone region, third overtone C-H stretching, N-H stretching and water content (H2O)[24].
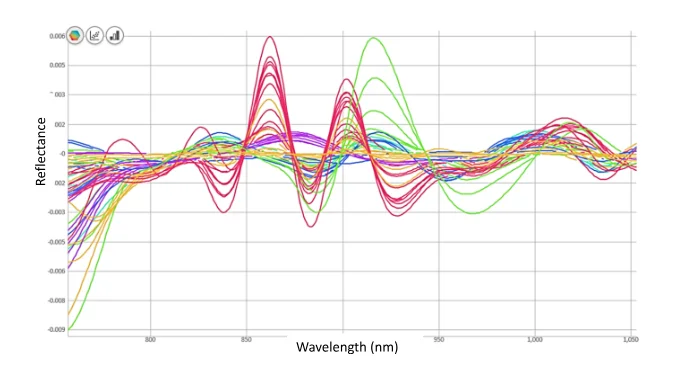
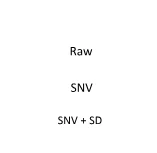
All the samples in the dataset of fabric materials used for multi-classification prediction model by using first the raw data, SNV, then the pre-processing sequence (SNV, and second derivative) which is found out as reasonable potential pre-processing steps for SCiO data. A trail carried out with different pre-processing method like using first rather than the Second Derivative, but it shows poor multi-classification prediction model. Also, a specific wavelength was selected [800 nm-1000nm] because it contains the most detected peaks, but it shows no improvement in the prediction model. Also, a binary classification model performed as one versus one fabric material sample prediction (i.e. Cotton samples versus Denim samples) because for the cloud, it is not allowed to edit the collected dataset for binary division, so the model is created in one versus one binary classification sequence. The algorithm selected was Random forest (RF) to perform the prediction model. The spectrum of different pre-processing methods shown in supplementary A.
3.1.1 Model validation
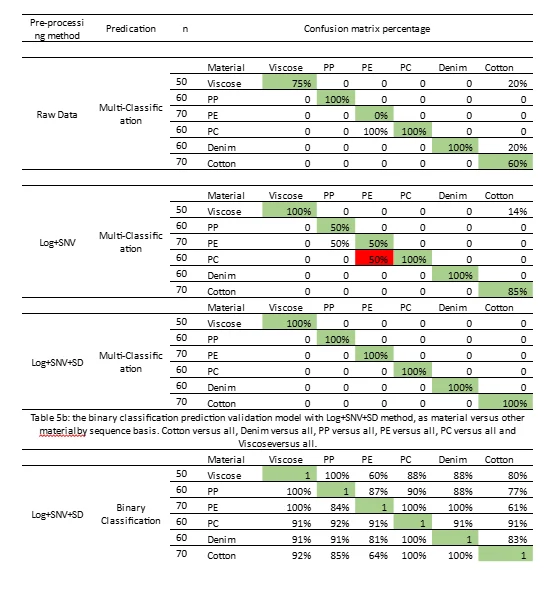
The classification models are created in this step with K-fold =5, which works as Leave-one-out cross-validation (LOOCV) to evaluate their performance. LOOCV is a process, selected within the build-in SCiO cloud system, which leaves out one sample from the calibration set, and use this sample for testing the model; it repeats this procedure till the end of testing all the samples. The sample ID was chosen as a batch of cross-validation because it is the most very attribute for all samples type. Table 3shows the validation output of material classification, which representsa percentage% of predication confusion. Unfortunately, the SCiO lab system with developing kit tool does not allow downloading the results foran external test validation for checking the performance or trying the data on anothermodel. So, the effects limited to the confusion matrix percentage, without showing the real positives, negatives, sensitivity, specificity, and accuracy. Although, the confusion matrix in table 3a, b shows the potential of SCiO in multi and binary classification in identifying the class of dyed fibres. The multi-classification model with (Log+SNV+SD) pre-processing shows a proper qualification predication as compared to the SNV only and Raw data, which has been selected to investigate the effects of different data pre-processing methods in model construction.The binary classification also indicates a proper predication in terms of classversus other classessequence basis. Denim versus all, PP versus all, PE versus all, PC versus all and Viscoseversus all investigated. All samples quantity used in the model; the confusion matrix percentage shows potential in binary classification prediction in terms of material versus others.
3.2 DLP Data and Model
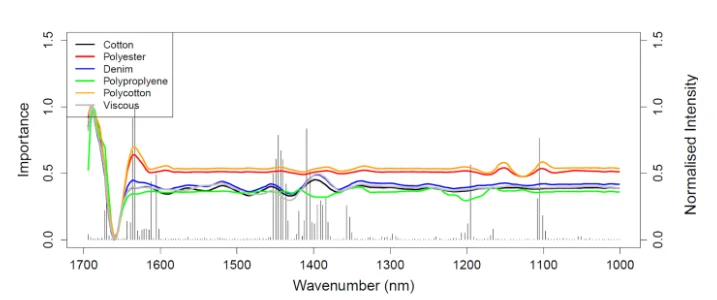
The wavelength range of DLP sensor is (1000-1700 nm) which represents the molecular vibrations of the functional group in the second and half of the first overtone region. As shown in fig 4, cotton is mainly cellulose and denim primarily manufactured by cotton with different dye application, C-H second overtone peak presented in 1200nm and N-H First overtone in 1480nm. While the synthetic fabrics like Polypropylene (PLP) have a chemical bond (C-H) and methyl (CH₃) group which represents in 1200nm,1400 nm and 1450nm, Polyester (PST) has CH₃ second overtone peak in 1122 nm, C-H first overtone peak in 1395nm and CH₃ first overtone peak in 1656nm. Polycotton blend made by polyester, which vwith polyester; also Denim is primarily cellulose, and spectra show the similarity with cotton, as well as Viscose with cotton and denim [17][18][19][27][28][29]. So, a model created with binary and multi-classification predication of those fabric materials to distinguish between the sample’s material using Random forest prediction trees by PRFFECT v2.0.3 chemometric software.
3.2.1 Model Validation
The RF Classification model created with all sample observed data after pre-processed by binning with resolution reduction by five factors, normalisation by a vector, and second derivative for baseline correction choice, which as potential data re-treatment. The model validation was done with K-fold =5 cross-validation internal, and check the model performance by the external dataset which has taken from pre-processed data in the split stage with Resample all function. The Gini-impurity also generated by the software to present the critical features in spectra, as shown in fig 4[30]. The Gini-importance shows, where the variable in the data relay on for classification, also it helps to present the wavenumber information were the functional group presented as discussed in section 3.2.
3.2.2 Binary Classification
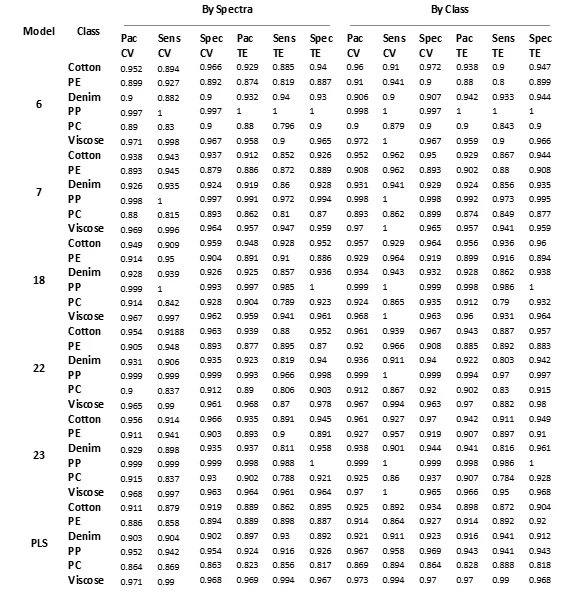
As a binary classification, Table 2 explains the way data has been used for the classification prediction model. The best five models result for the binary classification is shown in table 4 below. Also, the table presents the results of classification “by spectra” which use spectra data for modelling and further model predication by spectra data only, and “by class” which uses Sample ID in building the model rather than spectra data replicates. For the binary, 23 pre-processing techniques used in the investigation, Model 1 to 23 in tables 4. As shown in Table 6, the best classification happened as seen in model 18, which is involved pre-processing of binning by factor 2, min/max scaling normalisation and second derivative baseline option, no smoothing option. Although, the range of random forest model for binary classification was near perfection as it was (88% - 100%). The PLS model shows good results as well with model 18 parameters used; andthe range was (86%-99%). The specificity shows higher percentage than sensitivity in Denim and PC categories because of it is hard to classify both materials as denim originally made from cotton, but the difference between them is the dye application such as indigo dyed warp and white filling yarns [31]. PC is mainly 70% polyester, so it is expected to misclassify with polyester, but it still did a good classify above the 85% sensitivity for both training and testing sets. Although, we get a perfect classification percentage for Polypropylene average of 99%, Viscose 96%, Cotton 90%, PE 88% [26][13] . The full results scores for binary classification found in supplementary B.

3.2.3Multi-Classification
The multiclass-classification models were in total contains six classes, which represents the different fabric materials. Table7shows the mean results of the system model training and test sets, again as it has split after the pre-processing stage. Results output for a multi-class prediction model were good but lower compared to binary classification.The full results of all43 models for multiclass classificationin supplementary C.
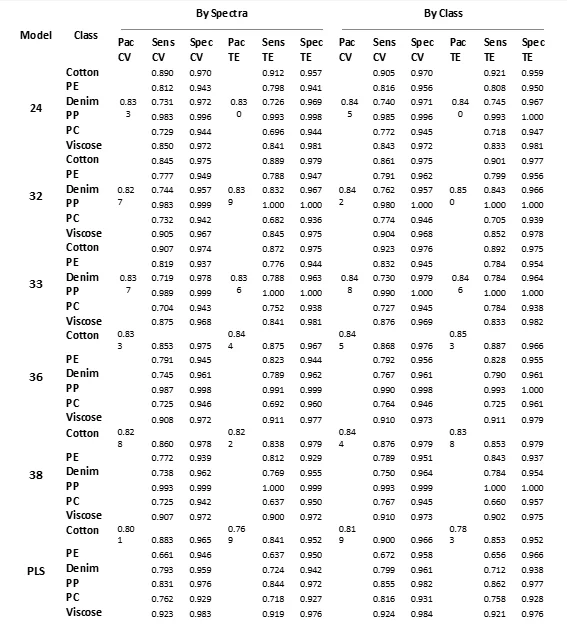
The multiclass classification random forest model best parameters were wavelet denoising parameter 4, min/max scaling and second derivative, with no binning. The result shows the high specificity over the sensitivity (still good) due to hard separate different fabrics except for PP, which is (98%-100%) Sens and Spec. The reason for hard separate those samples because of the similarity of origins between fabrics, as viscose is regenerated cotton, denim is originally cotton class. PC is 70% polyester, so it is hard to differentiate between PC and PE. The results show outstanding statistics matrices for spectra and class classification modelling. Overall, the DLP nano NIR sensor combined with classification statistics tool (PRFFECT) especially binary classification as random forest model or pls as well as SCiO with the Cloud system that shows reliability for fast, non-destructivetextile fibres in scenecomparison method.
Conclusion
This work investigated ability differences between two handheld NIR devices (SCiO®and DLP) to compare different fibres materials type for direct crime scene comparison purpose, by developing classification models to enhance the NIR technique for binary and Multi-class classification fabrics according to material type. Both sensors show high-speed data measurements and non-destructive to the samples. Random forest model generated by NIR data for both devices, which shows the potential of both sensors in fibres materials classification model. PRFFECT tool is used as a statistical program for DLP data, which allows a build-in algorithm, starting from data pre-processing with various methods, flexibility in creating models, and straight forward for real practical classification. It shows a predication accuracy average of training 89% and testing 91% for binary, and 81% training and 85% testing for multi-class. Unfortunately, SCiO Cloud does not allow to download the data for external investigation as well as does not show the model tuning options used, and the sampling method for model construction shows the confusion matrix information of RF model. Although, the confusion matrix shows 100% ability to differentiating between fabrics with a multiclass attribute and an 88% confusion percentage for binary classification. As this study shows the ability to identify difference between both spectrometers in examinetextile fibres and classification, it is required to study those instruments in real-life crime scenes scenarios with different scenes situations and different contamination on fabric samples. Also, it is recommended to investigate more portable handheld NIR’s with different classifications model for forensic purpose because the real-life forensic examination in crime scene requires instant comparison for fast results, exceptionallyvastand complicated crime scenes.
References
- Palmer, R., Identification and Comparsion, in Materials Analysis in Forensic Science, M.M. Houck, Editor. 2016, Elsevier: UK. p. 195-204.
- Palmer, R., The Forensic Examination of Fibers, in Interpols Forensic Science Review, N.N. Daéid, Editor. 2010, researchgate: Lyon, France. p. 182-190.
- Mistek, E., et al., Toward Locard’s Exchange Principle: Recent Developments in Forensic Trace Evidence Analysis. Analytical Chemistry, 2019. 91(1): p. 637-654 DOI: 10.1021/acs.analchem.8b04704.
- De Wael, K. and L. Lepot, Forensic Science, Applications of Raman Spectroscopy to Fiber Analysis, in Encyclopedia of Spectroscopy and Spectrometry (Third Edition), J.C. Lindon, G.E. Tranter, and D.W. Koppenaal, Editors. 2017, Academic Press: Oxford. p. 712-719.
- Ozaki, Y., C.W. Huck, and K.B. Beć, Chapter 2 - Near-IR Spectroscopy and Its Applications, in Molecular and Laser Spectroscopy, V.P. Gupta, Editor. 2018, Elsevier. p. 11-38.
- Was-Gubala, J. and R. Starczak, Nondestructive Identification of Dye Mixtures in Polyester and Cotton Fibers Using Raman Spectroscopy and Ultraviolet-Visible (UV-Vis) Microspectrophotometry. Applied Spectroscopy, 2015. 69(2): p. 296-303.
- Prego, P. and C. García-Ruiz, Spectroscopic techniques for the forensic analysis of textile fibers. Vol. 51. 2016. 258-281.
- Meleiro, P.P. and C. García-Ruiz, Spectroscopic techniques for the forensic analysis of textile fibers. Applied Spectroscopy Reviews, 2016. 51(4): p. 278-301 DOI: 10.1080/05704928.2015.1132720.
- Robertson, J. and C. Roux, Fibers: overview, in Materials Analysis in forensic science, M.M. Houck, Editor. 2016, Elsevier: UK. p. 171-175.
- Suzuki, E.M. and P. Buzzini, Applications of Raman Spectroscopy in Forensic Science. II: Analysis Considerations, Spectral Interpretation, and Examination of Evidence. Forensic Science Review, 2018. 30: p. 137+.
- Vaskova, H. and J. Hrano, Spectroscopic Measurement of Textile Fibres. Annals of DAAAM & Proceedings, 2018: p. 0331+.
- Rodgers, J., et al., Near Infrared Measurment of Cotton Fiber Micronaire, Maturity and Fineness - a Comparative Investigation Textile Research Journal, 2010. 80: p. 780-793 DOI: 0.1177/0040517509343780.
- Rodgers, J., J. Zumba, and C. Fortier, Measurement comparison of cotton fiber micronaire and its components by portable near infrared spectroscopy instruments. Textile Research Journal, 2017. 87(1): p. 57-69 DOI: 10.1177/0040517515622153.
- Baratloo, A., et al., Part 1: simple definition and calculation of accuracy, sensitivity and specificity. 2015.
- Ruckebusch, C., et al., Quantitative Analysis of Cotton—Polyester Textile Blends from Near-Infrared Spectra. Applied Spectroscopy, 2006. 60(5): p. 539-544 DOI: 10.1366/000370206777412194.
- Kitai, M.S. and S.I. Molchanova, Polymerization of fluoro-containing acrylic monomers: Determination of monomer conversion from absorption spectra in the near IR range. Polymer Science Series A, 2012. 54(3): p. 195-200 DOI: 10.1134/s0965545x12030042.
- Breiman, L. Random Forests. Machine Learning, 2001. 45, 5-32.
- Paul, R., Denim: manufacture, finishing and applications. 2015: Elsevier.
- 24/7 Customer Support
- 100% Customer Satisfaction
- No Privacy Violation
- Quick Services
- Subject Experts


