Evaluating the Role of Earthquake Early Warning
Introduction
Urbanization has rapidly progressed worldwide by developing cities in a wide variety of geographic locations including active faults and subduction zones and in this way has posed serious threats to properties and lives. Therefore, the implementation of mitigation measures for seismic risk is needed in large urban areas, which is a complex task that requires a multidisciplinary cooperation between scientists, engineers and decision makers. In recent times, a new approach has emerged for improving risk mitigation and post-earthquake emergency response based on a network of computerized seismic stations with automatic processing, which provides real-time information on earthquake parameters and expected ground motion. Furthermore, major computational improvements have been able to provide earthquake information before the ground shaking reached a certain target (e.g. a city). This development is currently known as Earthquake Early Warning Systems (EEWS) and is being tested and developed worldwide. The real-time assessment of an EEWS allows to estimate the intensity measure (e.g. PGA) at a target site before the earthquake hits and automatized actions which require milliseconds to seconds can be set. However, engineering demand parameters (e.g. lateral drifts or floor accelerations) have the highest level of structural information available and are best correlated with structural and, non-structural damage (e.g. drift-sensitive components, elevators functionality etc). Furthermore, non-structural damage accounts for 75% of the construction cost (Mondal and Jain, 2005) and its malfunctioning or collapse (e.g. windows, ceilings) pose a threat to the wellbeing and safety of occupants. Therefore, it is specifically reflective of the necessity to highlight the importance of seismic risk mitigation processes. Ground motion prediction equations (GMPEs) are commonly used to perform hazard analysis by estimating Peak Ground Accelerations (PGAs). However, PGA is only one component on the seismic behavior of mid-rise and high-rise buildings. Therefore, the implementation of Performance Prediction Equations that relates more appropriate performance indicators such as floor accelerations or lateral deformations to the earthquake features (e.g. Mw, Repi) is needed. Most of the current body of research has been focused on improving the real-time estimation of seismic features (e.g. Magnitude, epicentre, acceleration) and another branch of research has focused on the seismic performance and modelling of structures. However, there is still a gap in the knowledge on the combination of both research areas for the implementation of EEWS for engineering applications in buildings. To the knowledge of the author, this investigation presents the first attempt to evaluate the performance of an automatized warning method which could be focused on non-structural damage (building response).

Literature Review
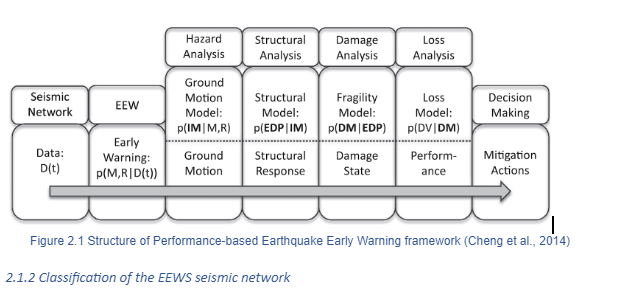
EEWS are real time information systems which take advantage of a network of sensor stations deployed in a region or at a specific site where the target to be protected is located. When an earthquake hits the sensors, seismic waves are registered and then a short time warning (up to tens of seconds) is communicated to take mitigation actions. This system is able to provide a warning on the potential damaging effects of an impending ground shaking by estimating the magnitude which will occur later. As a result, reduction of deaths, injuries and economic losses are achieved; as well as, a rapid rescue response and damage recovery could as well be made possible. The United Nations have recently promoted early warning and response systems, as the most effective strategy for the mitigation of diverse natural hazards and have provided guidelines for the implementation and the deployment of such systems, through the International Strategy for Disaster Reduction (Satriano et al., 2011) However, as the warning time duration could only range from a few seconds to a minute, an automatized decision-making approach is needed. With this in mind, a framework has emerged which integrates the seismic hazard analysis to loss models, called Performance-based Earthquake Early Warning (PBEEW). Figure 2.1 presents the general structure of PBEEW.
Typically, EEWS are classified as regional or site-specific, with recent innovation of combining the two types as a hybrid system. A regional or front detection approach covers a known seismic source zone located close to a threatened area, the information obtained is used to detect and locate an earthquake with a good level of precision. In this approach, traditional seismological methodology is used to determine the magnitude and intensity measure (IM) using ground motion prediction equations (GMPE) and a warning alarm can be transmitted to a specified target before the seismic energy arrives. As an outcome, applications such as shake maps, which consist of territorial distributions of ground shakings, are employed for emergency management (Iervolino, 2011).
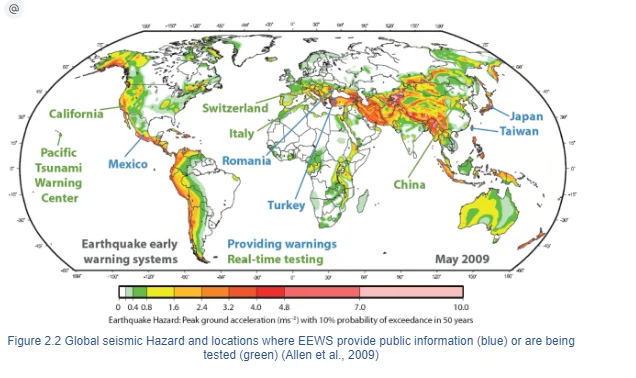
In case a well-known seismic source is located at a significant distance from a populated area, the system can provide a valuable warning time. However, if the target site is very close to the epicentre, this approach is not viable because the warning time will be too small or even null. This effect, known as the blind zone, affects the area where the warning cannot be issued in time. Around the world, different regional EEWS configurations exist. For example, the Seismic Alert System in Mexico (Espinosa-Aranda et.al., 2011) which is the first public warning system, the Japan Meteorological Agency (Kubo, et.al., 2011), ElarmS in California (Hellweg et.al. 2009), Presto in Italy (Weber et.al. 2007) and PreSEIS in Turkey (Böse et.al. 2008). In Figure 2.2, a map of global seismic hazard is presented along with active EEWS (blue) that are currently providing warnings to users and real-time seismic system (green) that are still being tested.
Moreover, pre-programmed security actions can be implemented in critical infrastructures (Shut down of nuclear reactors or deceleration of high-speed trains), facilities (controlled shutdown of high- technological manufacturing operations, bringing elevators to a stop at the nearest floor) or at personal level (workers can move away from hazardous positions, students can shelter under their desks).
On the other hand, the network for a site-specific approach is placed around a predetermined target creating a fence, which enhances the safety margin and decrease the vulnerability. In this approach, real-time seismology science is used to estimate the magnitude and intensity measure (IM) using the first few seconds of the earthquake together with ground motion prediction equations (GMPE). Sometimes, seismic sensors are installed within the structure, this is known as structure-specific system.
The theoretical lead-time for site-specific EEWS is defined as the time difference between the first recorded P-waves at the target site and the arrival of large energy amplitudes.(Zollo and Lancieri, 2008). The location of the sensors relies on the lead time required to activate the safety procedures before the arrival of the damaging S-waves. Furthermore, an alarm is issued when the ground motion intensity at one or more sensor exceeds a given threshold (Iervolino, 2011). Contrary to regional case, site-specific approaches measure the ground motion and there is no attempt to estimate with precision the seismic features such as magnitude and location due to the lack of computational time. The first portion of the earthquake is normally associated to P-waves, therefore in this approach, the predominant period of the first four seconds (pmax) is used to predict the ensuing ground shaking related to S-waves at the same location. This procedure provides a comparatively greater rapid alert which reduces the blind zone and increases the warning time but the parameters are poorly determined. (Iervolino et. al, 2005). Current efforts to develop and implement EEWS are based on the Peak Ground Acceleration (PGA) as a proxy for the expected level of damage (Iannaccone et. al., 2010, Kanamori, 2005). However, mid-rise and high-rise buildings show a dynamic behaviour that is not only dependent on the PGA, but on their fundamental period (height of the building), and structural system. Few examples exist on the literature about specific applications of EEWS for buildings (Kubo et.al., 2011, Chen et.al., 2014, Primavera, 2016), but there is still a need for more research on this topic.
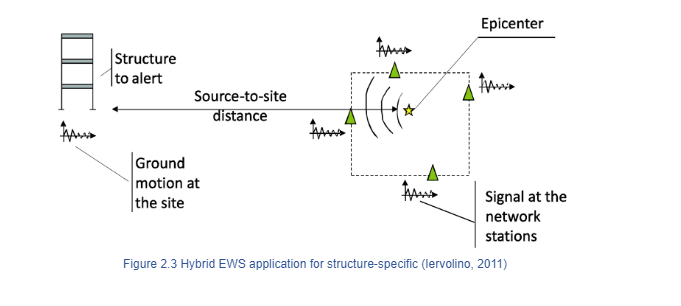
A hybrid approach combines regional networks and site-specific applications by estimating real-time predictions of peak ground motion using the information of source features from regional networks, while the earthquake could still be underway (Kanamori, 2005). For example, in Taiwan, Wu & Teng (2002) used the regional warning system already implemented to locate earthquakes and estimated magnitudes with the site-specific approach, using the first seconds of P-waves. In this way, the system provides 20 seconds of early warning after the earthquake could commence and reduces the radius of the blind zone from 70 to 21 km, proving that a hybrid application can enhance the usefulness and reliability of an EEWS. In 2005, the development and implementation of a regional EEWS was started in southern Italy, based on the seismic network deployed along the Apennines belt region where large and destructive earthquakes in Italy have occurred during last centuries. (Weber et al., 2007). The Irpinia Seismic Network (ISNet) constitutes 29 stations, covers an area of 100x70 km2 and uses a Real-time Probabilistic Seismic Hazard Analysis (RTPSHA) called Presto. As a result, location, magnitude and ground motion parameters are estimated in real time by combining the P-wave arrival time with the information that some stations have not yet triggered to identify the epicentre of the earthquake. (Iannaccone et al., 2010). Iervolino (2006) tested this probabilistic framework in the Campanian region for hybrid EEWS. Figure 2.3 presents a scheme of a hybrid EEWS.
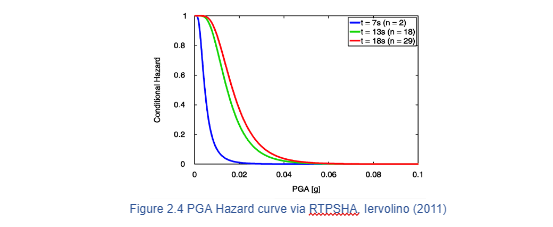
Iervolino (2009) carried out a sensitivity analysis to evaluate the sources of uncertainty in a RTPSHA approach in a Hybrid EEWS. The results show how the coefficient of variance is highly dominated by the uncertainty of GMPE compared to those of magnitude and distance. Consequently, the warning decisions taken by using this methodology may present high uncertainty if the GMPE is not well estimated. When only a few stations are triggered, the blind zone remains small and the lead-times are higher; however, the available information is not enough to estimate accurate parameters of magnitude and source-to-site distance and the probability of issuing false alarms increases. Figure 2.4 present a hazard curve using the RTPSHA approach, the prediction of the PGA does not benefit from further information and becomes stable after 18 stations could be triggered. Therefore, there exists a trade-off compromising the lead-time and information needed to issue an alarm.
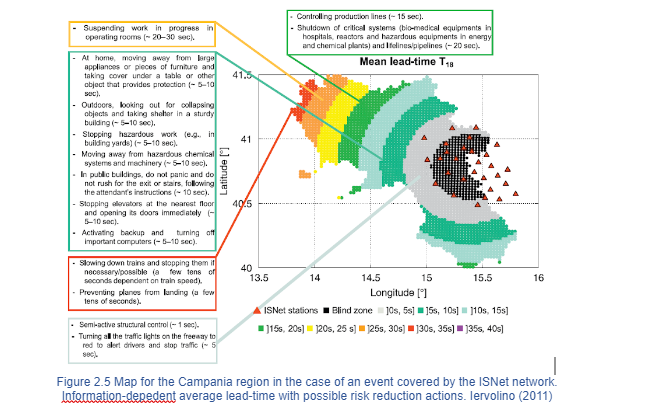
Additionally, an analysis considering as many randomly occurring epicentres in the region within the ISNet sensors was computed, Figure 2.5 presents a map with lead-times up to 40 seconds along with real-time risk reduction actions which can be performed in the available time. A number of different proposals for the refinement of the system have included the inclusion of threshold-based EEWS using the P-waves and initial peak of displacement at the site (Caruso et.al., 2017) or the cost-benefit study of the proposed warning measures through the setting of alarm thresholds based on expected losses (Iervolino et.al., 2007).
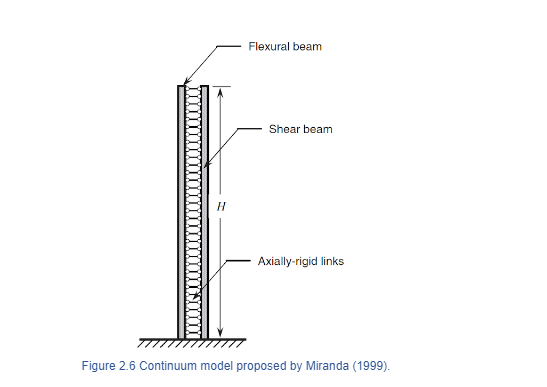
A growing need has emerged in emergency managers and city officials for a rapid seismic performance assessment (i.e. within few minutes) of large inventories of buildings in urban areas. The information obtained has to be a valuable tool capable of identifying structural and non-structural damage. The objective of Performance-Based Seismic Design (PBSD) is to assure an adequate building performance through the accomplishment of limit states defined along with the importance and function of the structure. For instance, after a seismic event, critical facilities are expected to remain in operational or at immediate occupancy level. Therefore, for this critical infrastructure it is necessary to estimate, among others, peak floor acceleration (PFA) demands and its distribution along the building height because it is well correlated with the seismic performance of supports and attachments of building contents. On the other hand, for less critical infrastructures, structural and non-structural damage is tolerated in life safety and collapse prevention levels, only if no structural collapse happens. In order to achieve the desired performance, it is useful to identify the required lateral stiffness. This parameter is related to the maximum interstorey drift ratio (MIDR), which is the result of lateral deformations that occur from relative displacement between consecutive floors. Mid-rise and high-rise buildings can be considered critical because they provide vital services to the functioning of a city such as hospitals, communication towers or government facilities. However, potential losses in more common buildings (i.e. offices or commercial) should not be underestimated because they can concentrate an important density of population. As a result, seismic events can produce large economic losses concentrated within a single building. Given that 75% of the construction cost is associated to non-structural components (Mondal and Jain,2005), it is also important to obtain an accurate prediction of seismic damage on them. It is known that, the shaking experience by a user in a high-rise building will be completely different from the one on the ground and varies according to the dynamic features of the structure. For example, during the Mw 9 Tohoku earthquake in Japan on 2011, ground motions were amplified by a factor of 3.5 at the roofs of some of the tall buildings (Cheng et al., 2014) causing severe distress on the occupants who did not know which actions to take on such a strong event. Usually, the procedure of obtaining the dynamic behaviour of a structure, is through a finite elements modelling approach along with an eigenvalue analysis. However, when the analysis is needed for a wide portfolio of buildings with different structural systems, this procedure is expensive and time-consuming. In order to address this issue, Miranda (1999) has developed a multiple degree of freedom (MDOF) model that is able to estimate displacement and acceleration demands for structures which remain elastic with a small number of parameters. The response is obtained in terms of engineering demand parameters (EDP) which has the highest level of information available of a structure. This robust and fast method produces relatively good results with a small amount of information and computational effort and is useful for rapid evaluation of existing buildings. Other models with non-linear characteristics such as Xiong et. al (2016) and De Luca (2014) are time consuming and should be used in case of the specifics of the analysis requiring them (e.g. extensive structural damage and non-linearity). The Miranda´s linear-MDOF model is an equivalent continuum structure which combines a flexural and a shear cantilever beam which, along the length, (both beams) undergo similar lateral deformations because they are connected by an infinite number of axially rigid member which transmit horizontal forces. Figure 2.6 present a scheme.
Multi-storey buildings frequently present a uniform mass and for economic reasons the columns are reduced in the final stories. Miranda and Reyes (2002) have shown that if no abrupt reduction occurs, this effect can be neglected for the dynamic characteristics of the model. As a result, masses and lateral stiffness are assumed to remain constant along the height. The response spectrum is based on an SDOF system which provides an approximate response of acceleration demands on structures. However, it cannot provide maximum interstorey drift demands, which are better related to the structural damages. Iwan (1997) overcame these limitations by introducing the drift spectrum which represents more accurately deformations of multi-storey buildings but it was not implemented broadly because a specialized expertise in wave propagation was needed. Miranda and Akkar (2006) proposed a simpler method called the generalized interstorey drift spectrum (GIDS) that considers shear and flexural deformations based on Miranda (1999) model. Combined with the conventional modal analysis presented by Miranda and Taghavi (2005).
Response prediction equation
Probabilistic Seismic Demand Analysis (PSDA) allows the evaluation of the structural behaviour based on the performance-based seismic assessment methodology. First, ground motion predictions are used within a Probabilistic seismic hazard analysis (PSHA) to derive intensity measures (IM), such as the PGA, as hazard curves on a determined site. Then, structural analysis uses the IM on the site to estimate an EDP on the structure and structural hazard curves can be calculated. As a result, EDP hazard curve presents the probability of exceedance for a critical threshold based on a specified structural parameter (Cornell and Krawinkler, 2000). The use of IM as an intermediary parameter introduces a source of uncertainty propagation and bias in the calculation (De Bortoli and Zareian, 2018). A novel concept, denoted as performance prediction equations, aims to merge these two stages by linking engineering demand parameters (EDP) directly to seismic features on the source. As examples of these innovative efforts, Neam and Taghikhany (2016) performed a regression analysis for GIDS considering near-fault ground motions with high standard deviations and De Bortoli and Zareian (2018) derived equations for floor displacement and inter-storey drift ratio, both based on the NGA-West database. Moreover, Koleva et al. (2008) derived an equation to estimate IDRmax only for shear wall structures the analysis was done with Mw ranging from 5.0 to 7.6 and Rjb100 km. Nonetheless, the residual plots showed slightly biased trends for increasing magnitude at longer distance. However, all these efforts were developed for specific applications and none of them were used in EEWS.
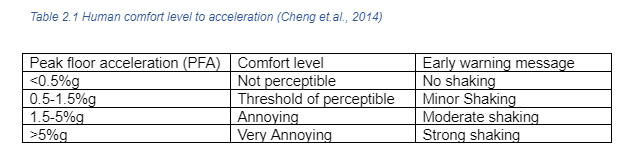
As mentioned before, the setting of an early warning alarm should be based on the probability that a structural parameter is exceeding a critical threshold. Diverse thresholds can be evaluated on buildings performance including structural and non-structural damage as in Hazus-MH 2.1. For instance, non-structural components criteria is divided in drift sensitive components (0.004) and acceleration-sensitive components (0.25g) both for slight damage and all building types. On the other hand, in the scenario that a person is subjected to a varying force with changing acceleration, such as an earthquake, the human body has to continuously adjust to a disturbance in his equilibrium (Cheng et al., 2014). Therefore, PFA can help measure the human comfort in multi-storey buildings during an earthquake. The relation between human comfort level and PFA is suggested in Table 2.1.
Additionally, elevators are integral to multi-storey buildings and its potential failure due to any earthquake must be considered. For instance, in the State of California is mandatory to install an earthquake sensing device on every elevator which will shut down if an acceleration higher than 0.5g is detected. On the other hand, Japan uses different thresholds (0.08g-0.15g) depending on the use and location of the elevator (Cheng et.al., 2014).
Scope of the research
New implementations have been developed for EEWS worldwide, specifically in Italy where the hybrid system have boosted the potential of regional seismic sensors for site-specific applications by estimating real-time predictions of intensity measures (e.g. PGA) using the information gathered in the first seconds of the earthquake record. The developments of real-time seismology have accomplished this important step for risk mitigation, and consequently, a meaningful warning time can be provided to the population. On the other hand, earthquake engineering has developed models which, using adequate simplifications, can assess the seismic performance of a wide variety of structures with limited data. This research has combined both branches of earthquake knowledge to evaluate the potential of EEWS for building applications, where intensity measures could no longer be considered to be reliable parameters for their seismic performance and the implementation of real-time assessment in terms of engineering demand parameters (EDP) such as drift demands and peak floor acceleration is needed. Due to the fact that typical warning times (tens of seconds) will not allow a complete evacuation for mid-rise and high-rise buildings in case of potential collapse, this dissertation has focused on non-structural damage such as falling hazards (e.g. building contents) or elevator serviceability and the mitigation measures that can be taken inside the building. Therefore, the two main research questions of this study are: How feasible and valuable is it to obtain real-time performance prediction equations for EDPs instead of the classical PGA? How the incorporation of EDPs in the EEWS framework can improve the warning performance? In order to investigate those main research questions, this study will carry out two main steps. The first one will develop performance prediction equations for a variety of mid-rise and high-rise buildings (typologies) based upon seismic features. This first step will be applied to Italy using the Italian Accelerometric Archive (ITACA 3.0) The second step will simulate an EEWS for the Campanian Region by including the performance indicators proposed. In this way, the EEWS will not be able to predict only real-time PGA but additionally more meaningful information for buildings and its occupants.
Methodology
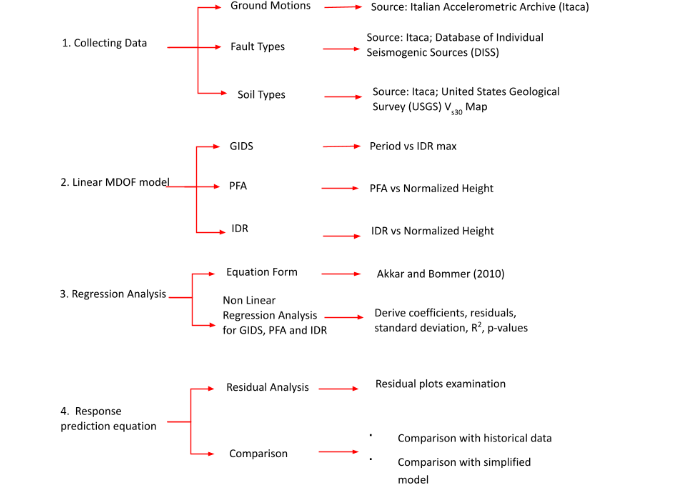
This dissertation will use a quantitative methodology in order to investigate the research questions outlined in the previous chapter. Figure 4.1 shows the 5 stages which have been briefly summarized below. Stage 1: Ground motion records from the ITACA database are compiled with their corresponding flat file including Mw, Repi, soil type and fault mechanism. Stage 2: The seismic records are used as an input to a linear-MDOF model to evaluate the seismic behaviour of a range of building typologies with varying fundamental periods and structural systems. Stage 3: Prediction equation forms are selected based on specialized literature. Then, non-linear regression analyses are carried out with the structural parameters (e.g. peak floor acceleration, maximum inter-storey drift) and the seismic features. Finally, statistical parameters, equation variability and goodness of fit is analysed in order to select the best equation. Stage 4: The response prediction equation is derived and validated using historical records. Additionally, a comparison with two simplified models is done. Stage 5: A simulation of EEWS is developed for the Campania Region for different earthquake scenarios. Alarming thresholds (e.g. elevator functionality) for real-time hazard curves in terms of PGA and structural parameters are set and the warning performance is compared. The following chapters will cover and develop each of the stages in detail.
Ground motion Data Selection Criteria
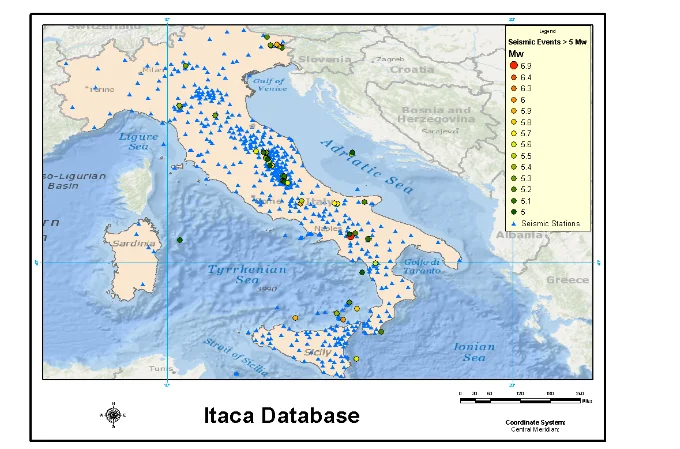
While synthetic earthquakes can be simulated in order to obtain a wide variety of seismic records, real records have been generally considered to provide the best representation of seismic behaviour for structural assessment (Galasso,2013). Therefore, the first stage was focused on collecting relevant historical data with information of ground motion records, fault types and soil properties. The Italian Accelerometric Archive (ITACA 3.0) has free access of moderate to severe earthquakes occurred in Italy from 1972 until now. ITACA (http://itaca.mi.ingv.it ) was created by the Italian Department of Civil Protection and the Italian Institute for Geophysics and Volcanology (INGV), it contains 41,444 waveforms of 1,883 seismic events from 1,378 recording stations with magnitudes values up to 6.9 Mw. (December 2019) The database provides two type of magnitude measurements used: Local Magnitude (ML) for events up to 4 and Moment Magnitude (Mw) for stronger events. Likewise, two type of distance definitions are evaluated: Epicentral distance (Repi) for events with Mw 5.5 and Joyner-Boore distance (Rjb) for severe earthquakes, the best sampled distance ranges from 5 to 100 km. In case the Repi or Rjb was not given, the distance has been calculated according to Haversine formula where the longitude and latitude of the station are needed along with the earth radius = 6371 km.
The soil types are classified according to Eurocode8 where the average shear-wave velocity in the top 30 m. (Vs30) for each class is A: Vs30≥800 m/s, B: 360≤ Vs30≤800 m/s, C: 180≤ Vs30≤360m/s, D: 180≤ Vs30 and E is a combination of C or D underlain by stiffer material. In case the of a soil type characterising record is not provided the classification has been made from USGS Vs30 map which estimated the site conditions from topographic slope. The main seismic sequences that gathered most data are L’Aquila (2009), Umbria-Marche (1997), Friuli (1976) and Irpinia (1980) where a single station recorded the seismic event with a Rjb≤10 km. The historical data obtained is going to be fundamental for the validation of the new building response equation analysed in the next chapter. Moreover, the Italian Appennines belt where the case study takes place provided a large amount of data with a depth of 5 to 20 km and mainly normal fault mechanism. (Pacor et al., 2011). From the ITACA database a flat file was created by performing the following criteria:
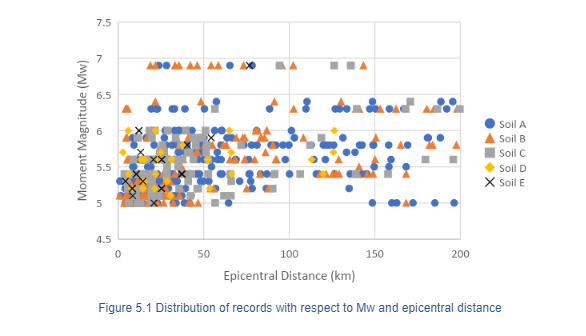
After this procedure 589 horizontal records from 55 seismic events are chosen, the final flat file is compiled in Table 5.1. Since EEW system have an extremely short time window and it is not possible to provide an accurate extent of the fault rupture, the analysis was done only considering epicentral distances. The moment magnitude versus Repi distribution according to each soil type is shown in Figure 5.1. It can be seen that most of the available records are soil A (rock) and occurred in a radius between 0 and 50 km epicentral distance. As a result, it is possible that the distribution will produce a bias in the building response prediction equation. A brief summary of the number of records related to the Mw, Repi and soil type are presented in Table 5.2 to Table 5.4. Furthermore, the location of 55 earthquakes and 566 seismic stations distributed along Italy is presented in figure 5.2.

As has been highlighted in the previous chapter, the EDP, which could be best correlated with structural damage, is the maximum IDR, and, the damage associated to non-structural components is normally related to PFA. This stage was focused on analysing the ground motion records obtained in the previous stage, and obtaining the respective EDPs by simulating a wide variety of building typologies. Matlab R2018a©, hereafter refer to as Matlab, is a mathematical computing software developed by MathWorks used to perform this simulation. In order to obtain the dynamic response of a wide range of structural systems representing the building stock of a city, the continuum flexural-shear model proposed by Miranda (1999) was implemented for the present investigation. This model can present either bending to shear configurations, by just modifying the lateral stiffness ratio (α) which is a dimensionless parameter that controls the degree of participation:
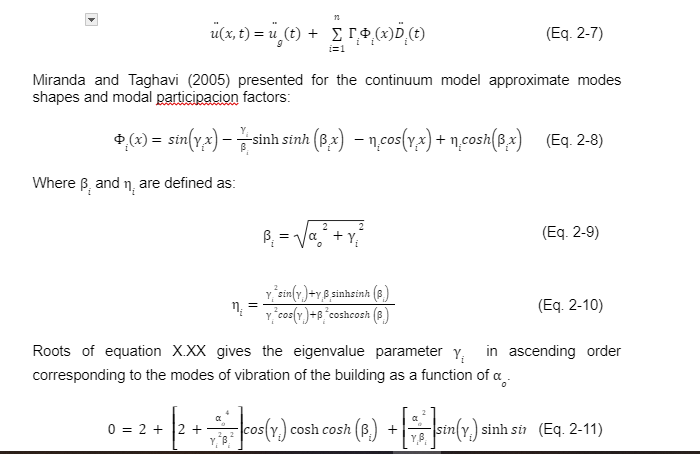
Where EI is the flexural rigidity, GA is the shear rigidity and H is the total height. A value of α close to 0 represent a flexural model, an intermediate value corresponds to a configuration that combines shear and flexural deformations, a value equal to ∞ reproduce a pure shear model. Miranda and Taghavi (2005) proposed an approximate earthquake analysis for a continuous structure with elastic behaviour, where the response can be computed as the superposition of individual modes of vibration as the following:
Where n corresponds to the number of modes needed, uix,t is the lateral displacement of the ith mode at non-dimensional height x at a time t varying between 0 to 1 at roof level. Additionally, i is called the modal participation factor, Фix is the mode shape at height x and Dit is the displacement at time t of a single-degree-of freedom (SDOF) system with a period and damping ratio corresponding to the ith mode of vibration of the building. Likewise, absolute acceleration can be calculated by adding the ground vibrations to the relative acceleration:

- the fundamental period of vibration of the building (T1)
- modal damping ratio (ξ)
- lateral stiffness ratio (o)
- 6 translational modes of vibrations in each direction were examined because these provide a better contribution to the acceleration demands and contain at least 90% of the system total mass. An accurate building response is expected for low to high rise buildings as stated by Reinoso and Miranda (2005)
- 15 fundamental periods were considered for capturing different building heights. The range was tested for 0.1 to 0.5 s with a 0.1 s step, 0.75 s and then for 1 to 5 s with a 0.5 step.
- 3 lateral stiffness ratio () considering shear to flexural configurations have been analysed. Taking into account the consideration given by Miranda and Reyes (2002) the values selected for shear walls (α=0.1), dual systems (α=8) and moment-resisting frames (α=30)
- Masses and stiffness distribution along the height were considered uniform and linear.
- The total height of the structure given a fundamental period is calculated using the empirical relationship suggested for ACE7-2010 for generic structures
- A constant modal damping ratio characterizing the structure in both directions was set to ξ=5%
- The analysis of IDR and PFA was done considering a 0.01-unit step for the normalized height for better accuracy.
The function modal analysis presented in Section A.3 of Appendix, describe the equations (2.8 to 2.13) used to obtain the modal shapes, modes of vibrations and modal participation factors for the linear-MDOF model. The process describes a linear-MDOF system, with each translational mode of vibrations previously calculated, subjected to different ground motion records from the flat file. Each script calculated relative displacement and acceleration, respectively. Taking in consideration equation 2.6 to 2.7, the computations of generalised inter-storey drift, inter-storey drift ratio and peak floor acceleration for different lateral stiffness ratios and fundamental periods have been presented in Section A.1 and A.2. As a result, a total of 26505 analyses have been performed using the aforementioned Matlab scripts. The final response has been calculated by combining the two horizontal components (X and Y) using the geometric mean. Three performance indicators were estimated for the different building typologies: The Generalized Inter-storey Drift provided maximum interstorey drift ratio (MIDR), which is the maximum deformation between adjacent floors during the seismic motion. Inter-storey Drift Ratio (IDR), which is the deformation between adjacent floors for each of the storeys computed for the building. Peak Floor Acceleration (PFA), which is the maximum acceleration obtained in one of the storeys along the building height during the seismic motion.
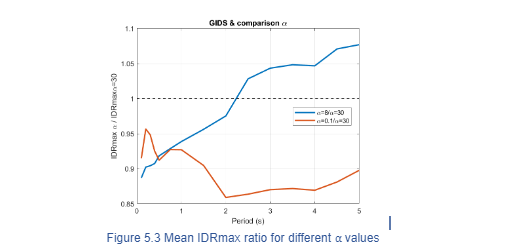
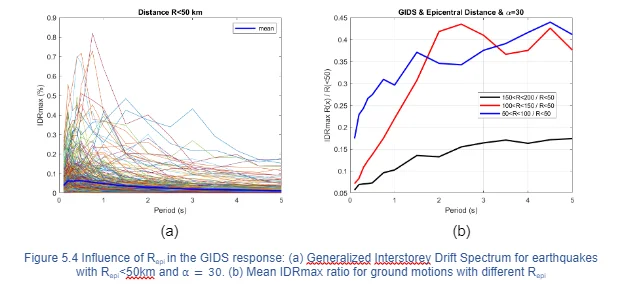
Therefore, we can consider that the influence of in IDR is low, therefore, following results are obtained by adopting a value of =30. In order to evaluate the importance of Repi, the analysis of GIDS was distributed in four groups. Figure 5.4(a) presents the GIDS for ground motion records with Repi 50 km, the MIDR is 0.82% for T= 0.75 s and it is reasonable that the mean has small values since the vast majority of records have low magnitudes. Figure 5.4(b) display the MIDR ratio for different Repi, the distribution occurs as expected, the response attenuates as Repi increases. The response for IDR with Repi 150 represents 20% of Repi 50, for fundamental periods greater than 2s. The response for IDR with 100 Repi 150 and 50 Repi 100 become similar at approximately 40% of Repi
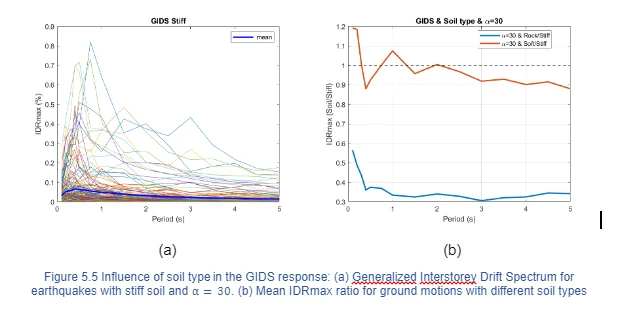
Likewise, the relevance of soil type in MIDR was evaluated for =30. Figure 5.5(a) present the MIDR for stiff soil, the graphics turn out to be almost identical to Figure X.XX(a) which implies that MIDR happens in stiff soil and Repi 50. Figure 5.5(b) shows MIDR ratio normalized by MIDR for stiff soil, as expected, the response with rock soil was considerably less in the range of 30%. On the other hand, stiff and soft soil present similar response with a maximum difference of 10%.
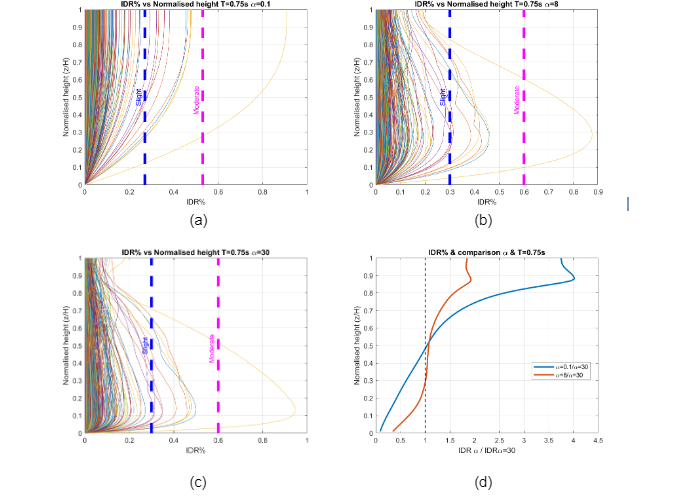
For buildings where flexural deformations (=0.1) govern, maximum interstorey drift demands occurred near the top as shown in Figure 5.6(a). In contrast, Figure 5.6(b) presents structures that combine shear and flexural deformations (=8) where larger IDR are experienced near mid height. While, buildings in which shear deformations (=30) dominated, IDR happen near the bottom as display in Figure 5.6(c). These results are consistent with plots presented by Miranda (1999) and Galasso (2013). The estimation of seismic demands given by a linear-MDOF model are expected to remain on the elastic range or with controlled levels of nonlinearity. The Federal Emergency Management Agency (FEMA) earthquake loss estimation methodology, commonly known as Hazus, has developed the estimation of various damage states for structural and non-structural components for 36 generic model buildings types that are classified in terms of their structural systems. The average IDR of structural damage states can be found in the Table 5.9a through 5.9d in Hazus-MH 2.1 Technical Manual and are presented as thresholds for the aforementioned figures. In this study, =30 and =8 correspond to Concrete Moment Frame (C1M) and =0.1 correlated to Concrete Shear Walls (C2M) both mid-rise buildings with moderate code design level. It can be observed that building response with moderate damage represent less than 1% of the total database and only one ground motion record, Friuli (1976), presents complete damage. Consequently, the building response of the flat file remains on the elastic range and the use of a linear-MDOF model is valid. Furthermore, a comparison for different values of is presented in Figure 5.6 (d). From base to mid-height of the building, IDR analysed with =0.1 and =8 is less than IDR computed with =30. On the contrary, from mid height to the top IDR ratio with =0.1 and =8 are up to 4 and 2 times greater, respectively.
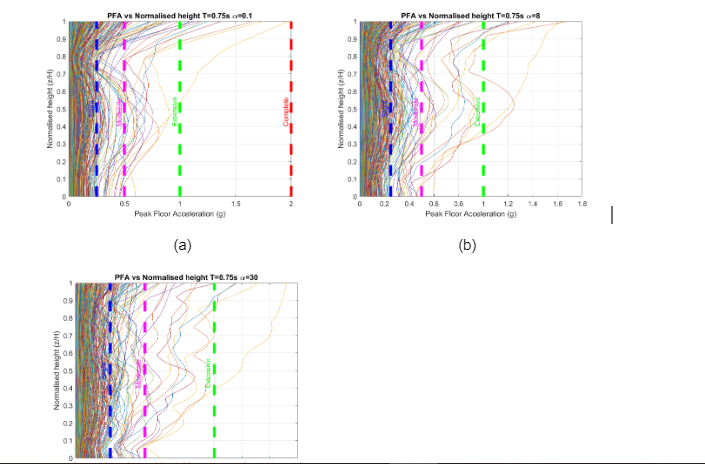
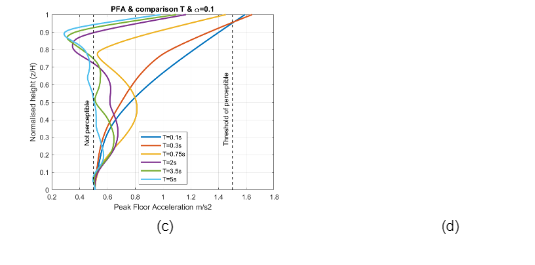
Multiple non-structural components and building contents, necessary for the functionality of critical facilities, are damaged as a result of large floor acceleration demands which represent a considerable cost for buildings operation. PFAs, estimated by the simplified model, are expected to remain in the elastic range when subjected to moderate earthquakes. Default threshold values of PFA for each of the damage states are summarized in Table 6.3 of Hazus-MH 2.1 Technical Manual. Figure 5.7 shows PFA vs normalised height for different and display the thresholds for each damage state which remain constant for all building types. A considerable amount of ground motion records still present slight damage, however, an increase of building responses with moderate damage has occurred. It is evident that buildings with smaller values of develop larger acceleration demands as height increases. The use of a linear-MDOF model is reasonable for non-structural components but the implementation of a non-linear model should be taken into consideration if the analysis had shown stronger non-linearity and severe structural damage. Figure 5.7(d) shows the influence of the fundamental period for PFA along the height, the accelerations are amplified as the period decreases and the height increases and regardless the value of , small periods present higher floor accelerations. Additionally, the thresholds of human comfort discussed in Table 2.1 are presented, where the acceleration on the roof for small periods start to be annoying and the elevators should be shut down for acceleration greater than 0.08g as has been recommended.
To sum up, a number of different analyses and comparisons have been done in order to show the complex seismic response of different building typologies. The models analyses show different acceleration propagation (reduction or amplification) and inter-storey deformations along the height. These estimates vary in magnitude and location (along the height of the building) due to the fundamental period, structural typology and soil type. Therefore, it is not possible to use a single performance indicator (e.g. PGA) to assess potential real-time damages during an earthquake and the indicators shown above will be tested on the next sections.
earthquake features, an empirical non-linear regression analysis based on the ITACA database was developed to determine the coefficients, residuals and standard deviations. The equation was formulated for IDR(x), MIDR and PFA(x) for three different lateral resisting systems with fundamental periods ranging from 0.05 to 5 s. The seismic features considered in the functional form need be rapidly predicted in real time, since they are going to be incorporate in an EEW framework. For that reason, only earthquake magnitude, epicentral distance and soil type were considered as dependent variables. The verification of the results are compared with historical data and validated by econometric tests. Additionally, a comparison with two additional complex models is performed in order to evaluate the influence of the fault mechanism type in the model.
The equation selected to perform the empirical regression is the model adopted by Bindi (2009) where Y relates to magnitude FM(M), distance FD(R,M), and soil amplification FS. The function is as follows:
- Y=YxYY represent the geometric mean of both EDP horizontal components such as IDR(x) and IDRmax expressed in percentage and PFA(x) expressed in m/s2
- bi regression coefficients to be computed
- FMM= b2∙MMagnitude scaling
- FDR,M= b3log10Repi2+b62 Distance function
- FS= b9Ss+b10SA Soil amplification
is the fractional number of standard deviations and is standard deviations Koleva et al. (2008) derived an equation to estimate IDRmax only for shear wall structures the analysis was done with Mw ranging from 5.0 to 7.6 and Rjbm 100 km. Nonetheless, the residual plots showed slightly biased trends for increasing magnitude at longer distance
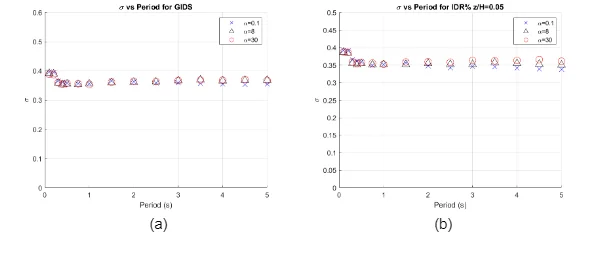
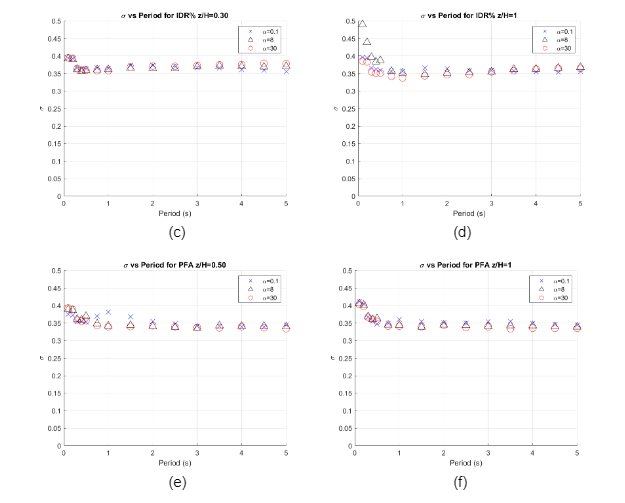
In the performance prediction equation, earthquake features represent predictor variables (independent) and EDP constituted response variables (dependent), as can be observed in equation 3.2, the relationship between these variables are not linear. In order to determine the coefficients a non-linear regression analysis was performed in Matlab, the scripts are presented in Section A.6 to A.8 of the Appendix. In the following paragraphs, the goodness of fit will be evaluated by statistical parameters obtained from the model. For example, standard deviation (σ) represents how the calculated values are spread out from the mean. Consequently, the variation of standard deviation versus the fundamental period is analysed for each EDP and different . Figure 5.8(a) shows σ associated with MIDR. Figure 5.8(b), Figure 5.8(c) and Figure 5.8(d), presents σ associated with IDR(x=0.05), IDR(x=0.30), IDR(x=1.00), where the maximum response happens for =30, =8 and =0.1,respectively. Figure 5.8(e) and Figure 5.8(f) shows σ associated with PFA(x=0.50) and PFA(x=1.00) where larger acceleration has been found. In general, the aforementioned standard deviation plots display a stable trend for fundamental periods larger than 1 s with an average value of 0.35, as a result it can be concluded that the standard deviation is not affected by fundamental periods or lateral stiffness ratio. In a similar work, Neam and Taghikhany (2016) derived a new prediction equation for MIDR considering near-fault ground motions where the standard deviations vary from 0.5 to 0.6 and σ also remains constant for different fundamental periods and .
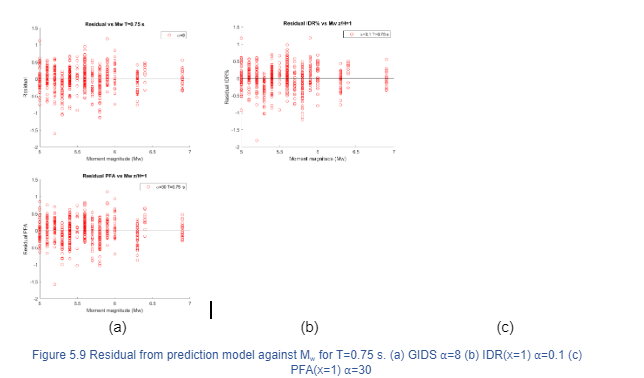
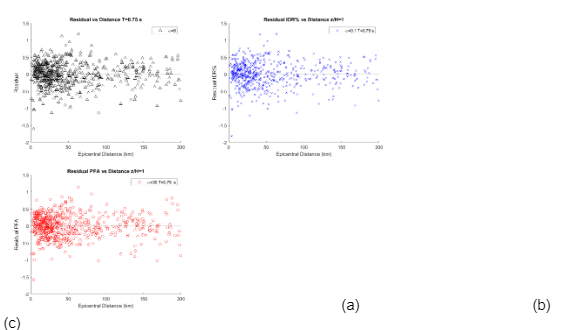
The stochastic error from the model is represented by residual values which indicate the difference between the observed and predicted values. In order to assess the appropriateness of the model, residual values are plotted versus independent variables. Due to space constraints, only relevant responses are shown below, Section A.9 of the Appendix shows a summary table of residuals associated with MIDR, IDR(x) and PFA(x) for different fundamental periods, and normalized height. Figure 5.9 and Figure 5.10 present the distribution of residual values against Mw and Repi for T=0.75 s. considering (a) GIDS =8 (b) IDR(x=1) =8 (c) PFA(x=1) =30. As can be observed, the scatter plot is equally and randomly spread around the horizontal axis throughout the range of fitted values. This indicates that the derived equation has produced unbiased estimates. Additionally, a linear trend of the residual plot has been computed and the output shows that the scatter is normally distributed with a symmetrical pattern around zero. Several ground motions records have Repi 50 km and it is expected that Figure 5.10 display more data on the left side. It is worth mentioning that similar results have been obtained for other fundamental periods, and normalized height. A summary table containing residual values corresponding to ground motion records is presented in Section A.XX of Appendix
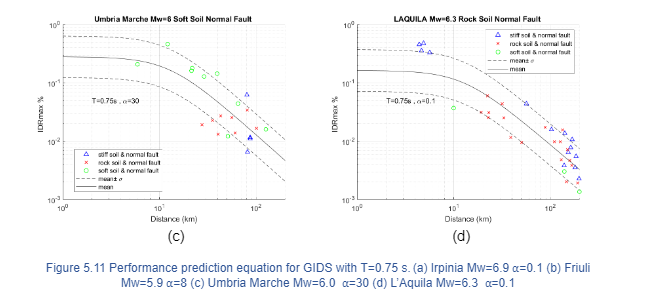
R2 or coefficient of determination measures the strength of the relationship between the model and the dependent variable, it represents the percentage of the variance and how good the data fit the regression model. The values fluctuate between 0 and 100% where higher values of R2 indicate that greater variation is accounted for and the data points are closer to the regression line. The overall R2 is in the range of 70 to 75%, which indicates a good fit of the data. The standard errors, the residual plots and R2 indicate a good fit for the non-linear regression and now it is possible to evaluate the statistical output in order to estimate the reliability of the function. The coefficients explain the relationship between the independent and dependent variables (); on the other hand, p-values show whether these relationships are statistically significant in a larger population. It is calculated by comparing the goodness of fit of the entire model to the goodness of fit when that independent variable is omitted. The null hypothesis tests indicate that no correlation exists between the independent and each of the dependent variables, in other words, that the coefficients of each of the variables have no effects in the equation and are cumulatively zero (0). In case the p-value is less than the significance level, the null hypothesis is rejected and the variable is considered statistically significant and a meaningful addition to the fit of the model. However, a larger p-value indicates that there is not sufficient evidence to conclude that a correlation exists at the population level. The significance level is a measure of the strengths of the evidence that must be obtained in order to reject the null hypothesis, in this case, a value of 0.05 (5%) was taken. Table 5.6 presents P-values for the coefficients from the regression analysis for EDP, it can be seen that all values are less than the significance level near zero, so in general, the coefficients improve the fit of the model.
The regression coefficients, standard deviation and R2 corresponding to the main response of MIDR, IDR(x=1.00) and PFA(x=1.00) for =0.1,8,30 are presented in table 5.7. The evaluation of the normalized height has been computed with an increment of 0.1 and the associated coefficients are presented in Section A.XX to Section A.XX. of Appendix.
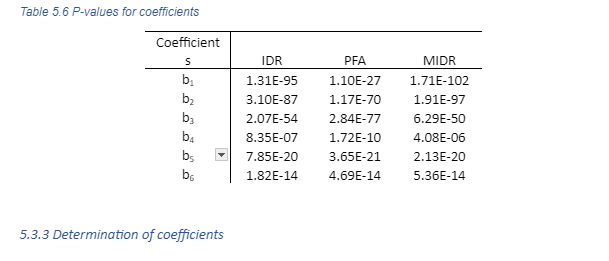
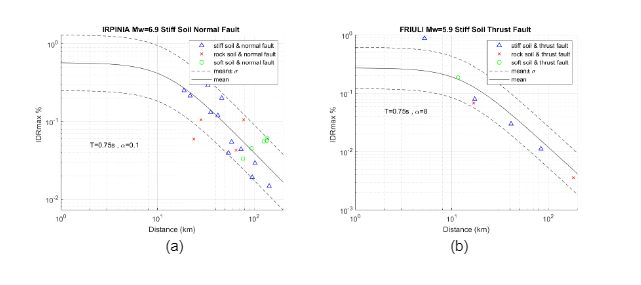
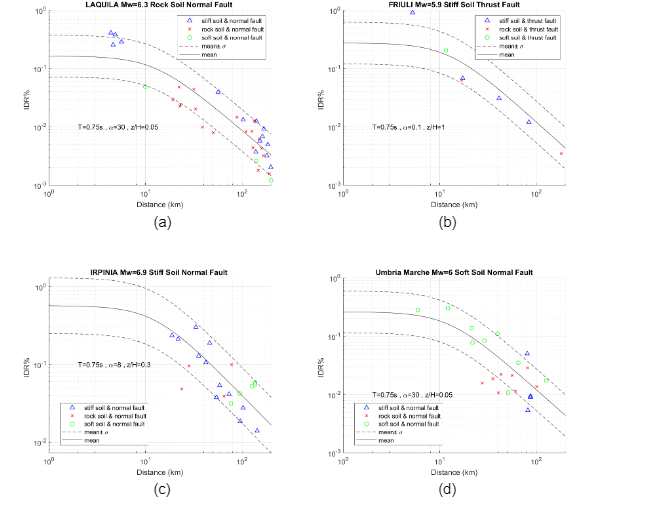
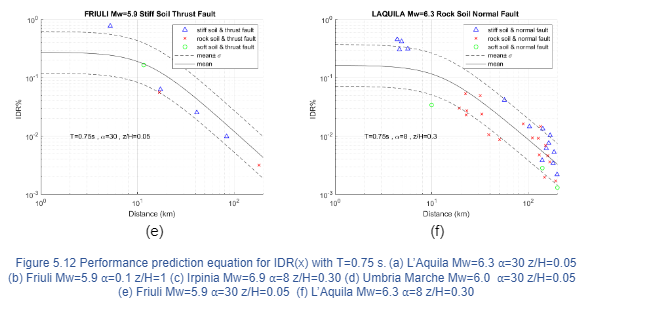
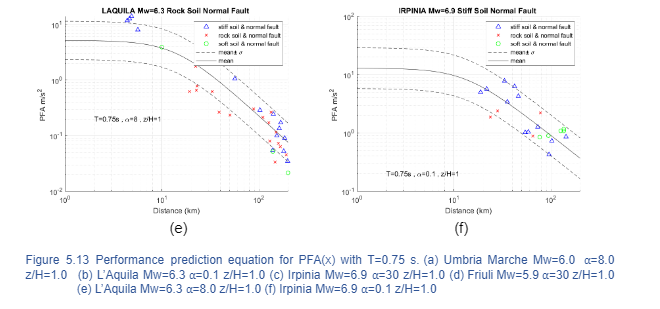
A comparison is performed between the new prediction equations characterized with different lateral resisting system and the building response parameters subjected to historical earthquake data for different soil types. The analysis is evaluated for a fundamental period of 0.75 s. where the higher response have been found. In order to validate the equation, the following seismic events with relevant data are selected:
- Friuli Third Shock 1976 Mw=5.9 Stiff Soil
- Irpinia 1980 Mw=6.9 Stiff Soil
- Umbria-Marche Second Shock 1997 Mw=6.0 Soft Soil
- L’Aquila 2009 Mw=6.3 Rock Soil
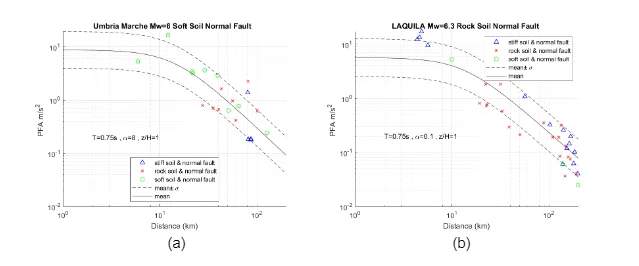
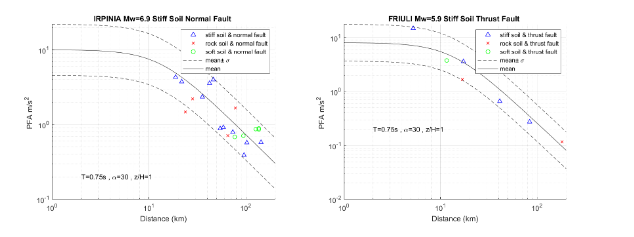
for different heights where the maximum drift happens and Figure 5.13 displays the trend for PFA (x) for the roof where the acceleration is higher. The building response is well captured for data with epicentral distance greater than 10 km; however, due to the lack of data, it is complicated to be reproduced with accuracy, a seismic event with small epicentral distance. Moreover, the error given by prediction equations and building responses for historical data identified with the same soil type is minimum. On the other hand, historical data identified with different soil type follows the prediction equation trend and often fall within the mean ± σ zone. The prediction equation trend happens as expected, the building response decreases as the distance increases. In general terms, the comparison suggests that the predictive model captures with reliability the building response of historical data with different soil conditions
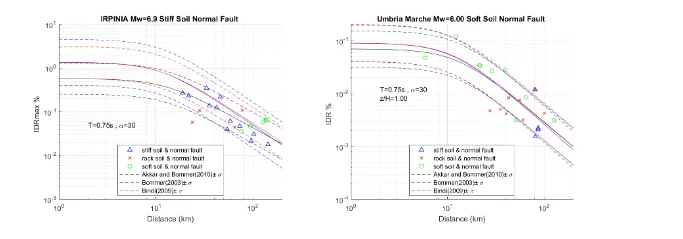
A commonerror is to develop a model too complex to fit a particular set of data points or for a particular application. Sometimes, the size of the sample limits the number of variables that can be added to ensure reliable results. Overfitting can conduct to misleading R2 and regression coefficients; as a result, the model is improbable to describe the relationship between variables for a whole population. For that reason, two more complex functional forms are investigated and statistical parameters are compared with the previous model. Bommer (2003) is presented in eq. 4-3 and includes the fault mechanism type on the other hand, Akkar and Bommer (2010) has been shown in eq. 4-4 and neglects the effect of M and Repi coupling terms.
The main statistical parameters and R2 are presented in table 5.16 and Table 5.17, respectively. The two complex models have more variables to analyse, it is expected that the standard deviation and R2 presents higher values; however, the difference between them is less than 3% which indicates that the models are reliable. Furthermore, Table 5.18 displays the p-values obtained for both complex models, the p-value for fault mechanism type (coefficient b8) indicates a low contribution to the model and a high probability that it does not belong to the equation and that there is a possibility that multicollinearity ihas been occurring. The results suggest that an overfitting problem has been taking place as well. In order to improve the p-values presented for the new equation model, more historical data that include different fault type mechanism is needed. To sum up, the new performance prediction equation presents reliable statistical parameters and predicts with accuracy the response of historical data. The analysis for the three prediction models was performed for historical seismic events where the highest response occurred for MIDR, IDR(x) and PFA(x) and it is presented in Figure 5.14. Akkar and Bommer (2003) overestimated the response and some historical data falls outside the mean ± σ zone. The building response is well captured specially for the prediction equation of Bindi (2009).
Assessment of the EEWS Application to Campania
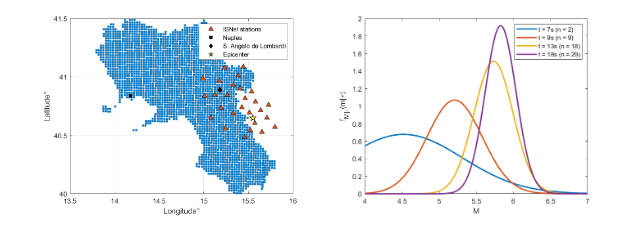
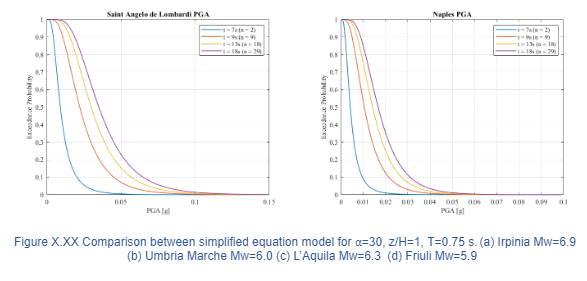
The Performance-based Earthquake Early Warning framework, displayed in Figure X.XX, presents the ground motion prediction equation and structural model to describe two separate stages comprising the hazard and structural analysis. As a result, a new performance prediction equation that merges these two stages and connects the corresponding seismic features with the structures characteristics of a building was created in the previous chapter. For decision making and seismic risk management purposes, a representative measure of the earthquake potential has to be obtained. At a given time t, real-time information of magnitude (Mw) and distance (R) is issued by EEWS, the probability that a ground motion intensity measure (e.g. PGA) is exceeded during the service life of the structure is calculated via a Real-time Probabilistic Seismic Hazard Analysis (RTPSHA). The prediction process is based on a Bayesian framework in which the posterior probabilistic density function f1,2,...,n represents the magnitude calculated at a given time by the triggering sequence of a developing earthquake in a seismic network via the Bayes theorem. The Gutenberg-Richter recurrence relationship incorporates data from past earthquakes where the seismic features of the Campania region are described by {β=1.69, Mmin=4, Mmax=7} . The seismic stations provide a vector (τ) with information of the predominant period from the first four seconds of P-waves records which are analysed in the frequency domain and the maximum amplitude of the record is extracted with the associated frequency. (Convertito et. al, 2008). Since the magnitude is a selected parameter, the posterior PDF was obtained with an inverse procedure and the vector have been generated by a Monte Carlo approach using the function elaborated by Allen and Kanamori (2003), presented in equation X. XX. However the parameters are computed for California, a further research is recommended to implement this approach in Italy.
The posterior PDF is presented in equation 2-3 It can be observed that, is time dependent and the quantity of data process will increase with time as the earthquake triggers more seismic stations. Figure X.XX(b) shows the real-time PDF of M and how the prediction become stable on the magnitude simulated.
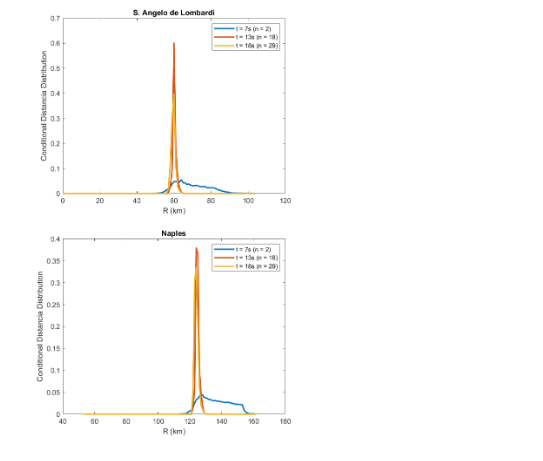
Likewise, the PDF of source-to-site distance is calculated at a given time by the triggering sequence of a developing earthquake given by a vector {S1, S2,.., Sn}. The RTLoc algorithm developed by Satriano (2008) is used for the real-time localisation of the hypocentre, this approach creates a dense grid point located inside the region where the network works. In order to obtain the probability that the hypocentre match that grid point, a volume that is likely to contain the hypocentre is calculated known as the Voronoi cell of that station. In this case, the PDF for the source-to-site distance was considered a deterministic parameter, because the analysis was performed for a target site with a known epicentre. Iervolino et al. (2009) investigated the uncertainty of the parameters used in a real-time hazard analysis and conclude that the dominating variability was associated with the ground motion prediction equations, the new performance prediction equation helps to reduce the uncertainty by simplifying the process. A new real-time hazard analysis have been computed in terms of building response in the hybrid EEWS for the Campania region using equation X.XX.
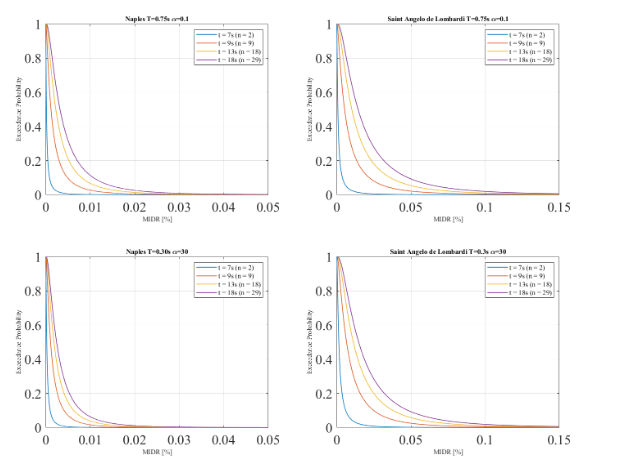
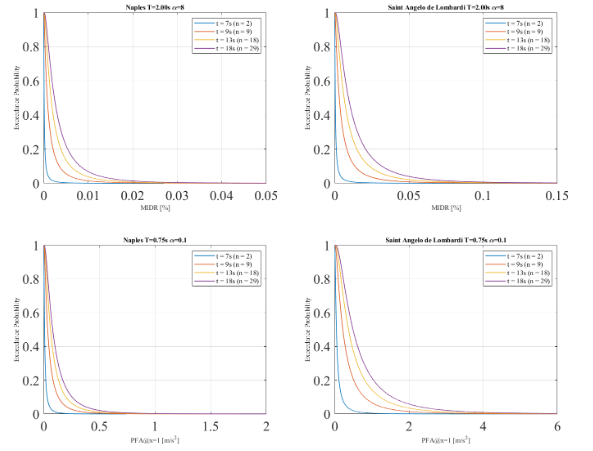
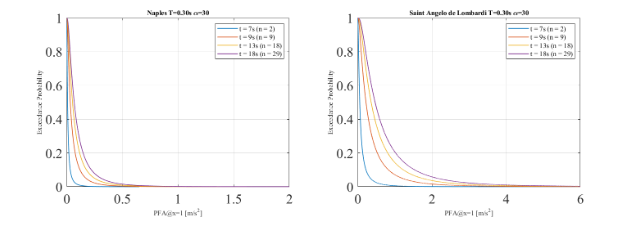
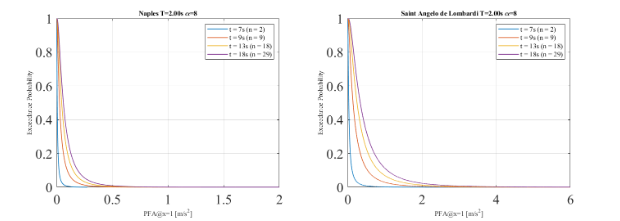
In this chapter a simulation of the development of an EEWS on the Campania region was carried out and real-time hazard curves in terms of building response are derived. The classical approach of setting alarms using the PGA as an intensity measure was compared with different performance parameters or EDPs such as Peak Floor Acceleration (PFA) and Maximum Interstorey Drift (MIDR). Given that the simulation is focused on mid-rise to high-rise buildings, the analysis has been carried out for the two biggest urban areas in Campania, Naples capital of the Campania region and Salerno. Saint Angelo De Lombardi, a small town affected by the Irpinia earthquake, was also considered for comparison reasons even though only small buildings are expected to be located in the town as shown in Table 6.1. Figure 6.1 (a) presents the target sites, the epicentre location and the geographical distribution of 29 seismic stations from the ISNet network. In order to obtain the RTPSHA, the analysis was performed in the Matlab script provided by the supervisor of this investigation, Dr. Carmine Galasso. Three seismic events were simulated with a Mw= 5, 6 and 7.The seismic event follows this triggering sequence: 2 stations (t=7 s.), 9 stations (t=9 s.), 18 stations (t=13 s.), 29 stations (t=18 s.), if 4 s. have passed from its trigger, the station is considered in the simulation process. The simulation evaluates three different earthquake scenarios by comparing real-time hazard curve in terms of PGA and performance parameters with an alarming decisional rule focus on elevator failure, non-structural damage and human comfort. There is an important branch of the literature discussing the issue of setting thresholds in order to prevent a significative number of false alarms and missed alarms, which is called the crywolf effect (Iervolino et.al., 2007; Grasso et.al., 2007). This issue becomes of importance when the cost of implementing a warning is high, for instance, when a critical infrastructure such as a nuclear plant or energy generator is shut down. However, in the proposed cases of setting early warning in buildings, the cost of alarming is considered not significant. Therefore, the alarming decision was set based on a 10% probability of exceedance. A more refined threshold can be estimated based on a cost-benefit analysis (including expected loss and expected utility) as done in Iervolino et.al (2007). This potential improvement is an area of further research.
Elevator failure
Failure is understood as the potential trapping of occupants during an earthquake or the malfunctioning of the system and slow restoration afterwards. These risks can be mitigated by implementing an automated early warning system that provides enough time to stop or shutdown an elevator depending on the available warning time. In Japan, 50% of the elevators Otis are equipped with earthquake detectors so passengers can exit safely, also during the Tohoku-Oki earthquake; several elevators performed an emergency shutdown. (Layne,2011). A threshold of 0.08g has been selected for the warning based on the Japanese Regulation (Cheng, 2014), and the differences in the EEWS outcome was evaluated with two parameters: PGA and PFA. In this case, the warning will be twofold: an automated system to stop the elevator in the nearest floor so passengers can exit; and a warning message to the occupants of the elevator saying: “An earthquake is expected to arrive in x seconds, the elevator will stop at the nearest floor”. As can be seen in Table 6.1, neither the PGA nor the PFA activates a warning for a seismic event of Mw=5 in the 3 target sites. On the other hand, a Mw=6 earthquake does not activate the alarm for any parameter in Naples, but both parameters (PGA and PFA) exceed the threshold in Saint Angelo di Lombardi. More important, 4 missed alarms are presented in Salerno, this means that a warning that should have been activated (based on PFA) was not triggered by the use of PGA. For the stronger Mw=7 event, both
parameters activate the warning for Salerno and Saint Angelo di Lombardi, however 5 missed alarms occurred in Naples. To sum up, from the 28 cases analized for Mw=6 and 7, PGA was able to activate the warning correctly in 19 cases (67%) but failed in the other 9 (33%).
Non-structural components collapse hazard
Non-structural components can pose threat on the occupants if the seismic shaking is strong, therefore, an early warning to shelter or go to a safety zone is proposed. These components are classified in drift-sensitive components which are affected by building displacement with a corresponding MIDR threshold of 0.4%; also, acceleration-sensitive components which are affected by building shaking with a corresponding PFA threshold of 0.25g. Both thresholds were selected as aslight damage level based on Table 6.4 of Hazus-MH 2.1 In this case the warning will be a message to the occupants of the building saying: “An earthquake is expected to arrive in x seconds, stay away from windows and look for a safe area on your floor”.

The occupants’ comfort during an earthquake.
Several studies have demonstrated a relation between peak accelerations and human comfort (Griffis, 1993). Therefore, a strong shaking can cause an important level of distress and fear even though the structural integrity of the building is not compromised. A threshold of 0.05g has been selected for a “very annoying” comfort level (Cheng, 2014), a comparison was performed in terms of PGA and PFA regarding the outcomes of the EEWS. In this case the warning will be a message to the occupants of the building saying: “An earthquake is expected to arrive in x seconds, the structure of the building is safe so please remain calm”. As shown in Table 6.3, a Mw=5 earthquake do not activate the alarm for any parameter in Salerno and Naples; but 2 missed alarms are presented in Saint Angelo di Lombardi. None of the parameters exceeds the alarming threshold for a seismic event of Mw=6 in Naples, however, both of them exceed the threshold in Saint Angelo di Lombardi and Salerno except a case in which a false alarm was found in the later. Both parameters are activated for all target sites for Mw=7 event. To sum up, from the 42 cases analysed, PGA was able to activate the warning correctly in 39 cases (93%) and had failed in the remaining 3 (7%).
Discussion and Further Research

While the reliable estimation of M and Repi is a source of variability, the GMPE has been proved as the main source of uncertainty (Iervolino,2009) for RTPSHA in EEWS. In the current effort of linking directly EDPs and seismic features on the source through performance prediction equations, this study carried the risk of increasing the uncertainty in EEWS and therefore losing reliability. However, the standard deviations calculated for the prediction equations developed herein are similar to the ones of the traditional GMPEs. Therefore, the uncertainty of the prediction has not increased and two stages (seismological prediction and structural modelling) in the EEW framework have been successfully merged.
Furthermore, the goodness of fit of the prediction equations were demonstrated, therefore automatized estimation of building performance can be carried out with seismic parameters estimated in real-time.
Some further refinements for the prediction equations remain as a further area of research. For instance, the inclusion of the fault mechanism as a relevant variable has been discarded due to their poor significance indicators in the regression model. This finding can mean that the data, on fault type, is not large enough to fit the model and a synthetic strong-motion database might provide better insights.
On the topic of intensity prediction using the first P-wave seconds, it is important to point out that the parameter is based on California data. The question of whether or not this parameter can become representative for the Italian case remains as a source of uncertainty and future studies for the Italian case are needed.
The implementation of the EEWS for buildings was used for Naples and Salerno, the two biggest cities of Campania. The location of these cities allows warning time of 5 to 10 seconds in Salerno and 15 to 20 seconds in Naples (Iervolino et.al., 2011) which are large enough to implement the proposed measures. However, nearest cities such as Saint Angelo have insignificant warning times or are located in the denominated blind zone. The development of warning measures for these sites can be possible if the lead-time is increased at the cost of losing reliability (usage of only a couple of stations). The evaluation of this important trade-off remains as a further area of research.
The EEWS simulation was based upon the selection of thresholds from the literature. However, these thresholds can vary depending on the specific features of each building. For instance, some elevators and windows can be more or less resistant by design and some building components might me more acceleration or drift sensitive. Therefore, a real application should rely on a proper estimation of thresholds for the particular case. The results showed in this study can vary if these thresholds change, so, they should be seen as a specific case and not as a demonstrated generalization.
The implementation of EEWS on buildings can be costly and take an important adaptation time for the occupants. However, mid-rise and high-rise buildings may have the financial capacity to undertake such infrastructure improvements. On the other hand, these buildings normally have automatized systems and communication systems (e.g. speakers) on each space, so, the implementation of the warnings described in this study can take advantage of this existing infrastructure. Furthermore, the wording of the warnings and the way of communicating them (lights, verbal, sms, etc) might be refined for each particular application.
Given that mid-rise and high-rise buildings are an important economic component of the city, the cost of interrupting their activities can be not negligible. Therefore, a cost-benefit analysis on the alarming decision remains as an area for further research. This is even more important for critical buildings such as hospitals in which elevators are certainly a life-safety component and should remain operational specially after an earthquake hit.
Conclusions
This dissertation has shown the importance of using appropriate EDPs for the seismic performance of buildings by finding a wide and complex variation of performance along their height. This performance cannot be predicted by the PGA and more refined EDPs, as has been proposed in the previous study, are required to be utilised.
In order to estimate these EDPs in real-time, this study has developed and validated performance prediction equations for Italy. These equations have shown a good fit and an acceptable level of variability.
The performance prediction equations have been used to simulate real-time hazard curves in the region of Campania for different structural typologies and earthquake magnitudes.
One important conclusion of this study is the evaluation of the warning reliability by using EDPs. Iervolino (2011) proposed 18 stations out of 29 as the number in which the PGA prediction stabilizes and there is no need to include subsequent stations. This study proposes the same number of 18 stations until stabilization for the studied EDPs.
Furthermore, three potential early warning cases for non-structural damage in buildings were proposed based on available warning times and thresholds from the literature.
This study has demonstrated the poor performance of using an intensity measure, as the PGA, instead of EDPs for early warning systems in buildings. EDPs are much better correlated with structural and non-structural damages and therefore its real-time estimation and implementation in EEWS is a big improvement to prevent missed and false alarms. The case of elevator failure and its 33% of missed alarms are eloquent and shows an inadmissible performance by the PGA as a EEWS predictor. Furthermore, in the cases in which the alarming decision based on PGA is correct, the usage of EDPs shows a reduced alarming time and is therefore, more efficient.
Dig deeper into Establishing Theoretical Foundations and Conceptual Understanding with our selection of articles.


- 24/7 Customer Support
- 100% Customer Satisfaction
- No Privacy Violation
- Quick Services
- Subject Experts