Top MSc Clinical Pharmacy Programs | Complete Guide
Q1. What variables are included, and what type of variables are they?
It is very important to note that variables characteristic can be measured and that can assume different values. These test were carried out from the Behavioural Risk Factor Surveillance System" (BRFSS) by the CDC. Nevertheless, the variables that have been included from the research conducted by the CDC are but are not limited to, age, sex, income, HighBp, PhysActivity, veggies, BMI and Diabetes Binary. As a result, there are a total of nine variables in this test. That having been noted, age, income, 'HighBP', 'PhysActivity', 'Veggies' and sex are independent variables. And 'Diabetes_binary' are categorical. The variables 'BMI' and 'MentHlth' are continuous.

a. How should these variables be summarised?
To perform an effective summary, the variables must be split into independent and dependent variables. As a result, a simple bar chart is used to summarise these variables for one categorical/indigent variable. A stacked or clustered bar chart should be used to graphically represent the information from the cross-tabulation. Income, for example, should be summarised as an independent/categorical variable. The Independent Samples t-Test is where we may summarise the means and independent sample test. Graphical approaches, measures of dispersion, and measures of central tendency should be used to summarise continuous variables.
b. How many participants are represented?
The data has a row of 243,833that represents the total number of participants that managed to take part in this study. As such to conclude with 243,833participants were represented.
Q2. Have a closer look at the distribution of the variables income, physical activity, and vegetable consumption. Does this look representative? What could be the reason for this not being an accurate representation of the underlying population, and why would this matter?

The income data looks very positive; those earning $75,000 are 36.6%, which shows a balanced set of income. This is because only 3.7% earn less than $10,000, which means that there is not much variance in terms of the earnings of the participants.
Physical Activity
Table 1.1 below shows the frequency distribution table for the physical activity variable.

The distributions show that a higher percentage of participants (76.5%) falls into the category of those who participated in physical activity in the past 30 days. This shows that a higher number of the population is healthy and hence are not exposed to disease or getting heart disease. In this case, the variable is considered as accurate and has a representation of the underlying population by 76.5 %.
Consumption of vegetables
Table 1.2 below shows the frequency distribution of consumption of vegetables.
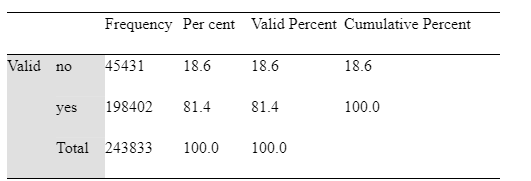
According to a review of fruit and vegetable intake in the population data presented, increased consumption of these foods might reduce heart disease by more than 30%. As a result, the data indicates a bigger number of participants or the population consumes more veggies. In this state, we can conclude that a bigger number of the populations are not likely to get diabetes due to the fact that they take a lot of vegetables irrespective of their social income or social status.
Q2. Describe the characteristics of the study population according to the different variables. Present your results in a Table but also summarise the findings in written text.


The study population is fairly diverse in age, with participants drawn from a wide range of age groups. Which is a positive representation of the population; however, the data shows that there were a larger number of women who took part in this study than men. Nevertheless, persons between the ages of 60 and 64 dominate the entire population, followed by 65 and 69 years old. Moreover, persons who are between the ages of 18 and 24 are only 2.3%, which is an alarming situation that should be looked into; the population is dominated by the elderly rather than the young. In terms of income levels, the person or group that earns above $75,000 or more is represented by 36.6%, with the lowest earning less than $10,000 being at 3.7%. This shows that the population is evenly balanced, with a larger number of working-class people who earn a larger amount of money per month. As far as physical activity is concerned, the data shows that 76.5% of the population engages in physical activity. This shows that the population is more concerned about their health and their living style. They aim at trying to reduce the chances of getting diabetes mellitus. Only 13.1% of the population has been diagnosed with diabetes mellitus (13.1%). However, 86.6% are risk-free, meaning they have not been diagnosed with diabetes mellitus. As such, the population is trying to embrace the consumption of vegetables at a very high rate (81.4%) in order to manage or reduce the high chances and risks of getting diabetes mellitus. For more insights and evaluation, a healthcare dissertation help offer the most valuable assistance.
Table 2.2: Descriptive Statistics
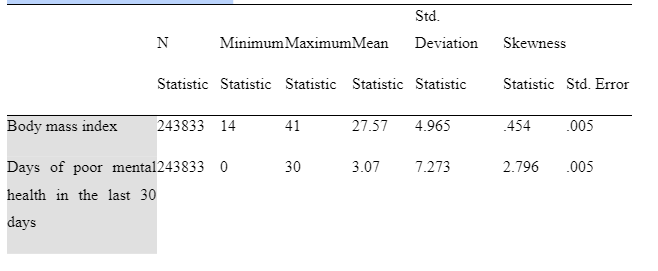

The population is generally overweight, with an average BMI of 27.57. The prevalence of mental health cases is low, with an average of 3 days of poor mental health in the last 30 days reported (Table 2.2).
Q3. Investigate whether high blood pressure, vegetable consumption, and BMI>=25
A logistic regression was performed to investigate whether high blood pressure, vegetable consumption, and BMI >=25 are risk factors for diabetes mellitus. Table 3.1 below shows the logistic regression results for determining whether high blood pressure is a risk factor for diabetes mellitus.
Table 3.1: High Blood Pressure

From the logistic regression analysis, 23.2% of the population with a BMI >=25 is living with or has been diagnosed with diabetes mellitus. With a BMI >=25, we expected to have a high number of people with diabetes mellitus due to the fact that, with a BMI >=25, it is possible that a larger population here has or is living with high blood pressure conditions. This means that the high consumption of vegetables is a major factor and an important aspect that has managed to help this population. A high consumption of vegetables enriches the blood stream of this larger population with nitrates. Nitrates found in leafy green vegetables help control blood pressure. According to 2021 research, eating at least one cup of green leafy vegetables per day can lower blood pressure and minimise the risk of cardiovascular disease. The 95% CI for the odds ratio is [4.814, 5.077], indicating that we are 95% confident that the true odds ratio is between 4.814 and 5.077. The p-value of 0.00 is less than 0.05, indicating that the association between high blood pressure and diabetes mellitus is statistically insignificant for this population, which consumes a high amount of vegetables. This means that there is strong evidence to suggest that vegetable consumption is associated with a reduction in the risk of diabetes mellitus for the population with high blood pressure.
Table 3.2 below shows the logistic regression results for determining whether vegetable consumption is a risk factor for diabetes mellitus. This fact is well represented in the figure below.
Table 3.2: Vegetable Consumption

The results show that the odds of having diabetes for those who consume vegetables vs. those who do not consume vegetables are 0.678, indicating that people who consume vegetables one or more times a day have 0.678 times the odds of having diabetes mellitus compared to those who do not consume vegetables one or more times a day. The 95% CI for the odds ratio is [0.660, 0.698], indicating that we are 95% confident that the true odds ratio is between 0.660 and 0.698. The p-value of 0.00 is less than 0.05, indicating that the association between vegetable consumption and diabetes mellitus is statistically significant. The result in general indicates that there is a decreased risk of developing diabetes mellitus with the consumption of vegetables 1 or more times a day (0.678 < 1).
Table 3.3. below shows the logistic regression results from determining whether overweight (BMI >= 25) is a risk factor for diabetes mellitus.
Table 4.3: BMI>=25
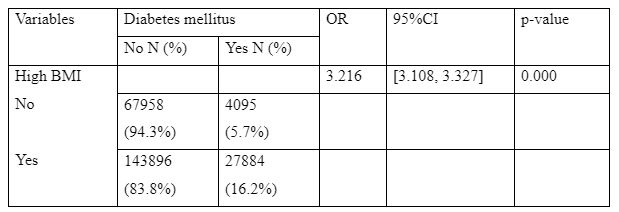
The results show that the odds of having diabetes for those with a BMI >=25 vs. those who do not have a BMI >=25 are 3.216, indicating that people with a BMI >=25 have 3.216 times the odds of having diabetes mellitus compared to those with no BMI >=25. The 95% CI for the odds ratio is [3.108, 3.327], indicating that we are 95% confident that the true odds ratio is between 3.108 and 3.327. The p-value of 0.00 is less than 0.05, indicating that the association between overweight (BMI > 25) and diabetes mellitus is statistically significant. This means that there is strong evidence to suggest that being overweight (BMI >= 25) is associated with a higher odd of having diabetes.
Q 4: Conduct appropriate hypothesis tests to assess:
a) Hypothesis to test whether BMI is affected by physical activity
An independent sample t-test was performed to test whether there was a difference in BMI between those who were physically active (n = 186,431) and those who were not (n = 57402). An independent sample t-test is used to compare the sample means of two groups and shows whether there are statistically significant differences in the means of the two groups. The null hypothesis (H0) is that there is no difference in the mean BMI between those who were physically active and those who were not. The alternative hypothesis (H1) is that there is a difference in mean BMI between those who were physically active and those who were not.
Table 4.1: Group Statistics

The group’s statistics in the table above show that in the last 30 days, only 27.22% of the population have managed to take part in physical activity, with 28.71% not taking part in those activities. However, there is a significant difference in terms of mean between those who took part in those activities and those who did not take part in those activities in the last 30 days.
Table 4. 2: Independent Samples Test
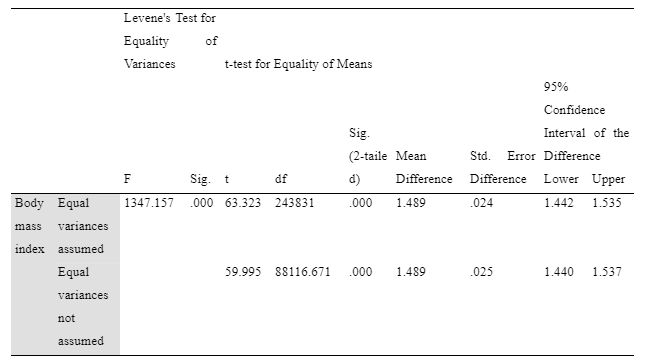
The results from the independent sample test in Table 4.2 above show that the p-value is less than 0.05. In this case, the null hypothesis is rejected, and a conclusion is drawn that there is a significant difference between the two groups: t (243831) = 63.323, p =.000. These results suggest that physical activity influences BMI and is an effective intervention for reducing BMI-related comorbidities.

b) Whether diabetes mellitus is affected by physical activity
A chi-square test of independence was performed to determine whether there was a difference in diabetes mellitus prevalence between those who were physically active and those who were not. A chi-square test of independence compares categorical outcomes across two groups. The test is used to determine whether two categorical variables are related or not. In this test, we are comparing a categorical outcome (Diabetes: Yes/No) across two groups (Physically Active vs. Not Physically Active). The null hypothesis (H0) is that diabetes mellitus is independent of physical activity. The alternative hypothesis (H1) is that diabetes mellitus is dependent on physical activity.
Table 4. 3: Chi-Square Tests

The chi-square test results in Table 4.3 above show the p-value to be less than 0.05. In this case, the null hypothesis is rejected, and a conclusion is drawn that diabetes mellitus is dependent on physical activity (1) = 2864.070, P =0.00. The results therefore indicate that there is a relationship between physical activity and diabetes mellitus.
Continue your journey with our comprehensive guide to Managing Sepsis in an Elderly Patient with Type.


- 24/7 Customer Support
- 100% Customer Satisfaction
- No Privacy Violation
- Quick Services
- Subject Experts