Sustainable Energy Sources: The Promise of Tidal Power for Long-Term Energy Security
Running head: SOURCES OF ENERGY 2
Advantages of Renewable Sources of Energy
1. it’s a renewable source
There is assurance of energy over a lifetime since the source doesn’t run out and can be reused as many times as possible, a source like tidal power from the seas can give robust and steady energy and serve a particular country over an extended period.
2. It's environmental friendly
This source of energy is eco-friendly providing either zero or small release of carbon or greenhouse emission. Non-renewable sources of energy highly release carbon to the environment and also have the greenhouse effect which contributes a lot to global warming, climate change and many other adverse effects on the environment (Tugcu, Ozturk & Aslan, 2012). For those pursuing studies in this field, seeking environmental studies dissertation help can be crucial in navigating these complex issues effectively.
3. Source of income
Renewable source of energy is cheaper and readily available and to some countries like Germany with their relentless effort have greatly embraced the use of renewable source of energy thus creating a lot of job opportunities which give stable incomes.
Disadvantages of Renewable Source of Energy
1. Requires high capital to establish
To create a functioning renewable source generating facilities requires an enormous amount of capital to purchase and they are relatively expensive. Also, there is the cost of maintenance, planning, and implementation is relatively high (Koroneos, Spachos & Moussiopoulos, 2003).
2. Unreliability
Renewable sources of energy rely on the weather like wind and sun to be able to generate the energy.In case the condition isn’t strong enough the machines won’t have enough power to generate the energy required.
3. Low-efficiency level
The program of using renewable sources is still new to the market, so the effectiveness of it is still doubtful henceforth investors tend to shy off due to the fear of not getting back returns.
Advantages of non-renewable sources of energy
1. Cost efficient
Non-renewable sources of energy are cheaper compared to renewable sources of energy and are easy use.
2. Abundant
One doesn’t require to go for long miles to access this kind of power since its abundant and readily affordable.
3. Good choice
Oil and diesel despite their high rate of pollution are still the best option for fuelling vehicles.
Disadvantages of non-renewable source
1. Used only once
Non-renewable resources can only be used once, and once they are gone, they cannot be revitalized.
2. Pollution
When fossil fuels are burnt they contribute a lot to global warming and a lot of land damages for those which are mined thus destroying the beauty of the ecosystem (Bowden & Payne 2010).
SANKEY DIAGRAMS

- the input is from the left of the diagram
- the wanted output is to the right
- all unwanted output is made to go vertically down
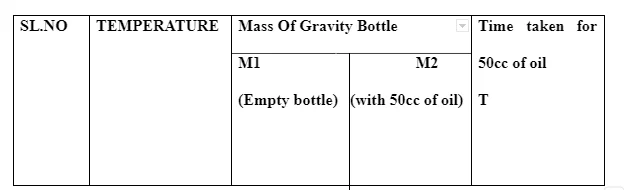
Experiment: To determine the viscosity of oil during heat transfer
Apparatus
Water bath, heater,redwood viscometer made of copper cylinder,kerosene,rubber,stopper volumetric flask,thermometer,orifice.
Continue your journey with our comprehensive guide to The Biomarkers and Personalized Medicine For Cancer Treatment.
Procedure
- Clean up the redwood viscometer using kerosene by opening the bottom of the stopper. Close the stopper.
- Place the oil to the mark and indicate its temperature.
- Indicate the mass of empty 50cc gravity bottle and keep it at the bottom of the viscometer below the orifice.
- Open the stop cock and allow the oil to flow into the gravity bottle. Indicate the duration taken to collect 50cc oil in the bottle.
- Indicate the mass of the specific gravity bottle with 50cc of oil and fill the oil into the viscometer.
- Switch on the power to the heater and indicate the temperature of the water bath and oil when the time remains constant.
- Repeat the experiment for several times and tabulate the results.

Density ꞊ mass/volume ꞊ ((m2-m1) × 1003)/50…………kg/m3
Redwood no. ꞊ (100×T×density)/ (535×0.915)
V ꞊ kinematic viscosity ꞊ (0.247 × T-(190/T)×10-6m2/sec
Absolute viscosity ꞊ density × volume
Mechanisms of Heat Transfer Methods
CONDUCTION
This is the process of heat energy being transmitted through a substance. Metals are good conductors of heat while non-metals also known as insulators are poor conductors of heat. Electrons in a piece of metal can move freely and leave its atoms; ions are tightly packed together are they continually vibrate. The electrons and the ions collide as kinetic energy is being transferred from hotter part to the cooler part of the metal (Qu & Mudawar, 2003).

CONVECTION
This is the movement of groups of molecules within fluids such as gasses and liquids and doesn’t take part in solids. It takes place through diffusion through the Brownian motion and advection (Heris, Esfahany & Etemad 2007).
RADIATION
It is the transmission of energy in the form of particles or waves through a medium. There are different types of emissions such as electromagnetic, particle, acoustic, gravitational, gamma rays, etc.
U VALUE OF A MATERIAL
U value of a material measures how effective a material is an insulator it is also known as thermal transmittance. U value of a material can be calculated by finding the reciprocal of the sum of the thermal resistances of each material. The following example considers a cavity wall.
Outside wall - 0.040 Km2/W
Clay bricks - 0.100m
0.77W/mK
0.130Km2/w
Glass wool - 0.100m
0.04W/mK
2.500Km2/W
Concrete blocks - 0.100m
1.13W/mK
0.026Km2/W
U-value ˭ 1÷2.916
0.343W/m2K
Determining the thermal transmittance of a material.
The nomenclature used in the methodology is:
A surface area m2 Emax maximum relative error %
E relative error % ej thickness of layer j m
hc convective coefficient W/(m2k) U thermal transmittance W/(m2k)
Q heat flux W/m2 Rse external surface resistance W/m2
Rsi internal surface resistance W/m2
RHF experimental thermal resistance obtained with heat flow-meter (m2K) W
RT Theoretical thermal resistance brought by the system (m2K) W
Ulab experimental thermal transmittance W/ (m2K)
E Hemispherical emission of the surface
ɵe External air temperature k
ɵi Internal air temperature k
ɵsi Internal surface temperature k
vse Wind speed m/s
PROCEDURE
- To experiment the U value of a material using IRT using different materials to build a box of 0.5 × 0.5 × 0.5.each opposite side is built with four materials (app.20mm thick) the materials are: medium density fibre board, natural cork, extruded polystyrene
- and cement bonded particle board.
- The top and bottom of the box are closed by an xps board with about 80mm thickness.
- The external surface temperature is measured using a flier infrared camera and the same gadget estimates the reflected temperature and surface emissivity.
- The air speed outside and inside the box and the superficial temperature are measured using copper thermometers of 0.2 mm wire (thermocouples) at an interval of 10s while wind speed was recorded by the anemometer.
- The results obtained are normally compared to the theoretical thermal transmittance.


References.
- Apergis, N., & Payne, J. E. (2012). Renewable and non-renewable energy consumption-growth nexus: Evidence from a panel error correction model. Energy Economics, 34(3), 733-738.
- Bowden, N., & Payne, J. E. (2010). Sectoral analysis of the causal relationship between renewable and non-renewable energy consumption and real output in the US. Energy Sources, Part B: Economics, Planning, and Policy, 5(4), 400-408.
- Heris, S. Z., Esfahany, M. N., & Etemad, S. G. (2007). Experimental investigation of convective heat transfer of Al 2 O 3/water nanofluid in a circular tube. International Journal of Heat and Fluid Flow, 28(2), 203-210.
- Koroneos, C., Spachos, T., & Moussiopoulos, N. (2003). Exergy analysis of renewable energy sources. Renewable Energy, 28(2), 295-310.
- Qu, W., & Mudawar, I. (2003). Flow boiling heat transfer in two-phase micro-channel heat sinks––I. Experimental investigation and assessment of correlation methods. International Journal of Heat and Mass Transfer, 46(15), 2755-2771.
- Tugcu, C. T., Ozturk, I., & Aslan, A. (2012). Renewable and non-renewable energy consumption and economic growth relationship revisited: evidence from G7 countries. Energy Economics, 34(6), 1942-1950.


- 24/7 Customer Support
- 100% Customer Satisfaction
- No Privacy Violation
- Quick Services
- Subject Experts