Business Analytics Data Analysis Report
Introduction
For the analysis of the different variables, the report has selected the 10 countries from Asia. The major data was collected from the World Bank related to population, GNI, per capita, inflation, exports of goods and services, Import of goods and services and CO2 emission. For the analysis data of countries related to the variables was collected from 1996-2015. If you require data analysis dissertation help, feel free to reach out to us for assistance. Following are the definition of selected variables:
Population: The term population refers to count of all residents regardless of legal status or citizenship. GNI per capita: This refers to Gross National Income (GNI) which is sum of value added by all residents producers plus and product taxes that is not including the valuation of output plus net receipts of primary income from abroad. It is calculated in national currency and converted to US dollars at official exchange rate for comparison across economics. Inflation: This measured by the consumer price index reflects the annual percentage change in the cost to the average consumer of acquiring a basket of goods and services that may be fixed or vary at specific interval. Exports of goods and services: It represents the value of all goods and services offered to rest of the world. This include value of merchandise, freight, insurance, transport, travel, royalties, license fees, and other services, such as communication, construction, financial, information, business, personal, and government services. They exclude compensation of employees and investment income and transfer payments.

Import of goods and services: Imports of goods and services represent the value of all goods and other market services received from the rest of the world. They include the value of merchandise, freight, insurance, transport, travel, royalties, license fees, and other services, such as communication, construction, financial, information, business, personal, and government services. They exclude compensation of employees and investment income and transfer payments. CO2 emission: Carbon dioxide emissions are those stemming from the burning of fossil fuels and the manufacture of cement. They include carbon dioxide produced during consumption of solid, liquid, and gas fuels and gas flaring.
Continue your journey with our comprehensive guide to Business Analytics.
Looking for further insights on the Role of Business Analytics? Click here.
Countries for analysis
For the analysis, there are 10 countries selected from Asia considering the largest land areas acquired. With a total land area of 31,105,763 km2 (12,009,997 mi2), Asia is far and away the largest continent on Earth. Asia features a wide range of biomes and climates, from the frigid tundra of Siberia in Russia to the deserts of Saudi Arabia to the equatorial jungles of Indonesia (Land areas of Asian countries, 2022). Following are the 10 major countries that were selected for current analysis of given variables:

Statistical method
For the analysis, descriptive method is used for analyzing the data of the countries focusing on the variables. For the representation graphical method is used. This has helped to identify the mean of the variables and provides the information related to the improvement and decline.
Results

Figure 1: Population total The graph has provided the information related to growth in population of selected countries from the year 1996 to 2015. According to analysis, population of all countries are increased between these periods of time but the significant improvements are noticed for China and India.
Mean population total


has provided the information related to the mean of population of selected countries. According to analysis, mean of population was highest in China 1302780250 total followed by India 1152924637 total and lowest in Mongolia 2586486 total.

GNI per capita

The graph has provided the information related to growth and decline in GNI of selected nations. According to analysis, the GNI of Saudi Arabia was strong as it was growing well in past years and highest among the other Asian countries.
Table 2: Mean GNI per capita, PPP

According to analysis of table 2, it has been carried out that mean GNI of Saudi Arabia was highest among the Asian countries 47056.5 per capita, PPP followed by Russia 14120.5. Moreover, the lowest GNI was identified for India 3254 per capita, PPP.

Figure 4: Mean GNI per capita, PPP
Inflation

Figure 5: Inflation, consumer price (Annual %)
The graph has provided analysis of inflation among the Asian countries for the selected period of time and it has been identified that Turkey has highest level of inflation followed by the Iran and Russia. The lowest rate of inflation was identified for Saudi Arabia.
Table 3: Mean Inflation, consumer price (Annual %)


According to table 3 it has been considered the mean value of inflation was highest for Turkey 29.56 consumer price (annual %) and followed by Russian 18.30 consumer price (annual %). The lowest mean inflation was identified for Saudi Arabia 2.07 consumer price (annual %).

Figure 6: Mean Inflation, consumer price (Annual %)
Export of goods and services

Figure 7: Exports of goods and services (% of GDP)
According to graphical analysis, it has been carried out that export of goods and services was highest for Mongolia and followed by Russia. However, the lowest level of export was identified for Pakistan.
Table 4: Mean Exports of goods and services (% of GDP)

According to table 4, the mean export of Asian nations was analyzed and it has been carried out that Mongolia was having highest exports 50.80 (% of GDP) followed by Saudi Arabia 47.11 (% of GDP). The lowest mean of export was identified for Pakistan 13.79 (% of GDP). The export plays a critical role in development and growth of the GDP of nations at government collect foreign currency that increase the value of exchange. Here, the GDP of China was so high compare to other Asian nations, therefore the comparative analysis shows less mean value of China and higher for Mongolia as their GDP is low compared to others.

Figure 8: Mean Exports of goods and services (% of GDP)
Import of goods and services

Figure 9: Imports of goods and services (% of GDP)
As per the analysis, the rate of import was highest for Mongolia followed by the Kazakhstan considering the % of GDP. Moreover, the lowest rate of import was identified for Pakistan.
Table 5: Mean imports of goods and services (% of GDP)

According to analysis of table 5, the mean value of import was highest for Magnolia 60.56 (% of GDP) that followed by Kazakhstan 37.02 (% of GDP). As per the analysis of the import level of countries, the lowest import of goods and services was identified for Pakistan 18.12 (% of GDP). The level of import shows that internal economy and manufacturing of country as they are producing all types for goods and services considering the needs of the population and able to satisfy by not taking the help of other nations. However, this calculation is done considering the level of GDP of country there for % of import varies accordingly.

Figure 10: Mean imports of goods and services (% of GDP)
CO2 emission

Figure 11: CO2 emission metric tons per capita
According to graphical representation, the level of CO2 emission is major problem not only for Asian countries but also for the world. As per the analysis of top 10 Asian nations by land area, the level of CO2 emission was highest for Saudi Arabia followed by the Kazakhstan. The lowest level of CO2 emission was identified for Pakistan.
Table 6: Mean CO2 emission metric tons per capita

From table 6, the mean value of CO2 emission was highest for Saudi Arabia 13.90 metric tons per capita that followed by Kazakhstan 10.68 metric tons per capita. The lowest mean value for CO2 emission was 0.75 metric tons per capita identified for Pakistan.

Figure 12: Mean CO2 emission metric tons per capita
Discussion

The study has analyzed the various variables for analysing the effectiveness and weakness of nations using the World Bank database from 1996 to 2015. The current analysis was done focusing on 10 biggest Asian nations by land area. According to outcome of the analysis, the population of all countries are increased between these periods of time but the significant improvements are noticed for China and India. According to analysis, mean of population was highest in China 1302780250 total followed by India 1152924637 total and lowest in Mongolia 2586486 total. According to analysis, it has been carried out that mean GNI of Saudi Arabia was highest among the Asian countries 47056.5 per capita, PPP followed by Russia 14120.5. Moreover, the lowest GNI was identified for India 3254 per capita, PPP. Moreover, the mean value of inflation was highest for Turkey 29.56 consumer price (annual %) and followed by Russian 18.30 consumer price (annual %). The lowest mean inflation was identified for Saudi Arabia 2.07 consumer price (annual %). According to analysis, the mean export of Asian nations was analyzed and it has been carried out that Mongolia was having highest exports 50.80 (% of GDP) followed by Saudi Arabia 47.11 (% of GDP). The lowest mean of export was identified for Pakistan 13.79 (% of GDP). Apart from this, the mean value of import was highest for Magnolia 60.56 (% of GDP) that followed by Kazakhstan 37.02 (% of GDP). As per the analysis of the import level of countries, the lowest import of goods and services was identified for Pakistan 18.12 (% of GDP). The level of import shows that internal economy and manufacturing of country as they are producing all types for goods and services considering the needs of the population and able to satisfy by not taking the help of other nations. Moreover, the mean value of CO2 emission was highest for Saudi Arabia 13.90 metric tons per capita that followed by Kazakhstan 10.68 metric tons per capita. The lowest mean value for CO2 emission was 0.75 metric tons per capita identified for Pakistan.
Conclusion
From the analysis, it has been carried out that mean value of variables like population, GNI, per capita, inflation, exports of goods and services, Import of goods and services and CO2 emission is varying across the period from 1996 to 2015 for 10 biggest countries of Asia by land area. There is significant improvement and decline was observed during the period of time for analysis considering the data provided by the World Bank.
References
Foster, S.J., Kuo, T.C., Wan, A.K.Y. and Vincent, A.C., 2019. Global seahorse trade defies export bans under CITES action and national legislation. Marine Policy, 103, pp.33-41.
Holland, J.H., 2018. The global economy as an adaptive process. In The economy as an evolving complex system (pp. 117-124). CRC Press.
Sultanuzzaman, M.R., Fan, H., Mohamued, E.A., Hossain, M.I. and Islam, M.A., 2019. Effects of export and technology on economic growth: Selected emerging Asian economies. Economic research-Ekonomska istraživanja, 32(1), pp.2515-2531.
World Bank, 2020. Global economic prospects, June 2020. The World Bank. Online
Land areas of Asian countries, 2022 [Accessed through] < https://worldpopulationreview.com/country-rankings/largest-countries-in-asia > [Accessed on 27 November 2022]
Table 1: PESTLE analysis of retail industry

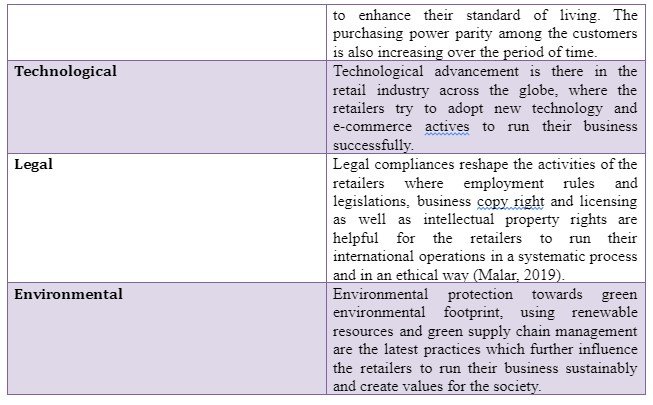
As per the recent trend in the retail sector, The customers prefer ecommerce activities and online shopping, due to this recent pandemic era of COVID 19. There is increasing sales volume and profitability of the firm in the recent years where the customers place their orders through online website and ecommerce services (Forbes, 2020). As there is downturn in the economic condition, the consumers prefer to get high quality products at affordable price and hence it is mandatory for the retailers to review their price ranges for the basket of goods and services. In order to create values for the customers, the buyers choose the baskets of goods and services with high quality and lower price (Sadler and Evans, 2016). Shifting towards customer’s expectation is also another trend, where all the retail firms try to create values for the customers by delivering quality products as per their personal needs and preferences. This is another effective strategy of the retailers to retain the customers for long run (KPMG, 2020). Rethinking the cost of doing business is another trend, where the cost cutting principle is not enough for the retailers to maintain margins to the business. The retailers think that they must choose cost leadership strategy in order to set affordable prices for their products (Forbes, 2020). Environmental sustainability management is another recent trend in the global retail sectors, where there is high environmental sustainability concern among the individuals the retailers also focus on developing green supply chain management in order to reduce the green house gas emissions and using electric cars for distributing the products efficiently (KPMG, 2020). The demand towards organic products is another recent trend, where the customers prefer to make effective purchase decision for the organic basket of goods and services for example, organic clothing and accessories as well as organic vegetables, fresh food items etc., further influencing organic farming (Deloitte, 2020). The business model of the retailer is also changing over the period of time, where they try to expand their business operations internationally to gain high competitive advantage. Through the online activities and direct expert strategy, the retailers try to expand their business across the globe and gain high market share (KPMG, 2020). Influential marketing strategy through offline and online activities is also another crucial retail trend where the organisations try to invest in marketing activities for expanding their business and attract new and old customers for the quality products and services (Deloitte, 2020).
Organisational strategic analysis
Sainsbury’s is the second largest supermarket chain in the UK, which has been established in the year of 1869. The organisation serves the customers across the UK and Ireland. The total numbers of shops of the organisation are 1428. Total revenue of the company in the last year was £29.007 billion and net income was £219 million (Sainsbury’s, 2020a).
Figure: Organisational logo

Total numbers of employees are more than 116400, where the employees are efficient to manage their activities and serve the customers efficiently. Through SWOT analysis, it is possible to analyse firm’s capability to sustain in the retail industry (Sainsbury’s, 2020b).
Table 2: SWOT analysis of Sainsbury’s

As per the SWOT analysis, the major strengths of the company are financial stability, strong employee base as well as product portfolio management, brand reputation and strong market share in the UK retail industry (Sainsbury’s, 2020b). However there are some weakens which are lack of marketing planning and low emphasise of market expansion for branding in the international markets. The purpose of the business is to help our customers live well for less. The major strategy of the company is to provide high quality products to the customers at affordable price son that the consumers can make effective purchase decision as per their personal needs and preferences and maximise their satisfaction (Sainsbury’s, 2020c). Additionally, as per the Ansoff matrix, it is possible to analyse the strategic planning of the company.
Figure: Ansoff matrix
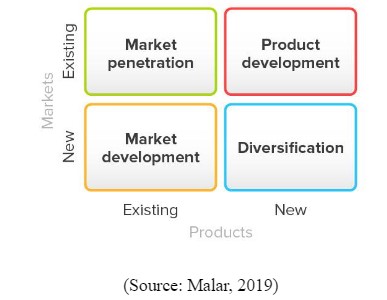
Quality products and affordable price are the major tactics of the company to secure future sustainable development by strengthening their customer’s base. The product range of the company includes food, health and beauty, home ware products, general merchandise, clothing and financial services. Hence, product diversification is another major strategy of the company through which Sainsbury’s tries to satisfy their clients and provide diverse products as per their choices and preferences (Sainsbury’s, 2020c). Product development and diversification provide a scope to Sainsbury’s to expand their business across the UK market and satisfy he customers with innovation basket of goods and services. The values of the company are such as choice, quality, low prices, convenience and great service (Sainsbury’s, 2020d). They try to connect with their customers and create values for them. Trust and internal bonding further helps the customers to choose the products and services of Sainsbury have and help the organisation to boost their profitability. These are the major strategic planning of Sainsbury’s through which the organisation focuses on running their operations in the UK and gain high market share in near future (Sainsbury’s, 2020d). The company also focuses on providing high return on the investment of the stakeholders so that they can handle the people, who are engaged with the business. The stakeholders are such as suppliers, distributors, employees and managers, customers, government and social communities as whole (Sainsbury’s, 2020c). The organisation tries to maximise their profitability and provide high return to the stakeholders to satisfy them and retain them for long run. The origination is efficient to expand the business through increasing the numbers of physical store, where the customers can select the right basket of goods and services. The strong supply chain management and distribution network are also helpful through which Sainsbury’s is efficient to fulfil the customers demand and gain high competitive advantage over other retail competitive firms in the UK industry (Sainsbury’s, 2020d).
Recommendations
The organisation Sainsbury’s must focus on more research and development program for running the operations efficiently in the market. Sainsbury’s also needs to strategise their business for market expansion. Market penetration is one of the major strategies that would be helpful for the organisation to gain high competitive advantage and represent the firm internationally. Sainsbury’s must expand the business in the emerging market economies such as Asian countries in order to offer their quality products to the diverse customers. Licensing and direct exporting are the major strategy through which Sainsbury’s would be able to expand their business internationally and penetrate the emerging markets for running the business profitably. Sainsbury’s is an efficient brand which has the capability to invest in the marketing planning and in this regard social media advertisement is crucial for the organisation to expand the business strategically. Through creating simple and concise content and attractive pictures about the brand and product range, the organisation would be able to develop Facebook post, which is one of the renowned online platforms for business growth and further promotion. Through social media advertisement, Sainsbury’s must share all the necessary information about products, prices and other organisational operations in order to attract the audiences and retain the old and new consumers efficiently. The organisation Sainsbury’s must focus on launching mobile application in order to enhance technological advancement and creativity to run the business. The new mobile application is suitable for the brand to promote the organisational products and services through the apps where the clients can install them in their smart phones and place their orders as per their personal needs and preferences. This further provides a scope to retain the customers and manage them by providing 24*7 services. Two way communication further helps to develop trust and bonding among the customers and organisational representatives. For strengthening the supply chain and distribution network, it is mandatory for the company to invest in electric cars to distribute the products by maintaining environmental sustainability. It is effective tactic through which Sainsbury’s is able to satisfy their clients. Retaining more efficient suppliers and hiring experienced distributors are also necessary to manage international supply chain and meet the organisational objectives.
Conclusion
Sainsbury’s is efficient and reputed brand and the company is successful to operate in the retail industry. The organisation mainly focuses on product diversification and tries to provide the quality products at affordable price. It would be beneficial for the organisation to utilise their resources and invest in marketing planning and market expansion strategy. International licensing and direct exporting are important strategy through which Sainsbury’s can expand their business in the international market. The company also needs to launch mobile application to attract the customers and make the order placement and payment method easy for the clients so that they can place their orders successfully though smart phones. The organisation also needs to strengthen international supply chain and enhance online sales activities through social media promotional campaign for gaining high competitive advantage in future.
Reference List
- Deloitte, 2020. 2020 retail industry outlook. [online] Available at: https://www2.deloitte.com/us/en/pages/consumer-business/articles/retail-distribution-industry-outlook.html [Accessed on 17 December 2020].
- Forbes, 2020. The 5 Biggest Retail Trends In 2021. [online] Available at: https://www.forbes.com/sites/bernardmarr/2020/11/16/the-5-biggest-retail-trends-in-2021/?sh=7dd1168926af [Accessed on 17 December 2020].
- Kasemsap, K., 2016. Retail marketing strategies and brand management: A global retail industry perspective. International Journal of Social and Organizational Dynamics in IT (IJSODIT), 5(2), pp.66-78.
- KPMG, 2020. Global retail trend 2020. [online] Available at: https://home.kpmg/xx/en/home/insights/2020/05/global-retail-trends-2020-preparing-for-new-reality.html [Accessed on 17 December 2020].
- Malar, M.S., 2019. Industry 4.0 Transforming Global Retail Industry. Indian Journal of Computer Science, 4(1), pp.19-25.
- Sadler, R. and Evans, R.D., 2016, August. Social Media Strategies in the Retail Sector: Analysis and Recommendations for Three Multi-National Retailers. In Proceedings of the The 3rd Multidisciplinary International Social Networks Conference on SocialInformatics 2016, Data Science 2016 (pp. 1-6).
- Sainsbury’s, 2020a. Our purpose. [online] Available at: https://www.about.sainsburys.co.uk/about-us/our-purpose [Accessed on 17 December 2020].
- Sainsbury’s, 2020b. Live well for less. [online] Available at: https://www.about.sainsburys.co.uk/about-us/live-well-for-less [Accessed on 17 December 2020].
- Sainsbury’s, 2020c. Our business strategy. [online] Available at: https://www.about.sainsburys.co.uk/about-us/our-business-strategy [Accessed on 17 December 2020].
- Sainsbury’s, 2020d. Corporate governance. [online] Available at: https://www.about.sainsburys.co.uk/about-us/corporate-governance [Accessed on 17 December 2020].
Take a deeper dive into Building Resilience for Sustainable Business Operations with our additional resources.


- 24/7 Customer Support
- 100% Customer Satisfaction
- No Privacy Violation
- Quick Services
- Subject Experts