Business Analytics- Utility Sales
1. Introduction
A major change in the contemporary business environment is the adoption of data as a key component in the decision-making process and strategizing. Among the decision making process include data collection, evaluation, analysis, and deriving information to inform a decision. The current buzzing word, business intelligence, is a termed conned from using data analytics to forecast trends and direction of business markets such as consumer purchasing behaviour, trends, forecasting opportunities, and threats based on data. Analytics in business involving making sense of data, gaining insight, and strategic decision-making such as forecasting and predicting the trends in a business environment. This essay report, analysis the data of utility data (sales by the Gas and public electricity supply systems) between 2007 and 2012 using two of the forecasting tool (time series and econometric) then use the information to decide appropriate the trends and direction of the sales.
2. Forecasting
a. Data description

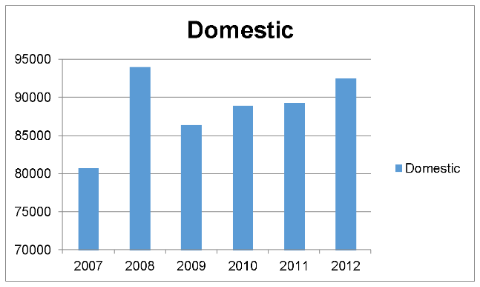
Data collected between 2007 and 2012 captured in a quarterly period. The data is for gas and electricity sales by supply systems. The electricity is categorised into commercial and domestic measured in terawatt hours. In terms of gas supply systems, the highest average could be realized in the year 2008 with a quarterly average of 93960.25 gigawatt hours. The lowest average could be realized in 2007 with a quarterly average of 80752.5 gigawatt hours. The figures and the graph below show the behaviour of the averages in terms of the gas supply over the years.

Take a deeper dive into Business Practice with our additional resources.
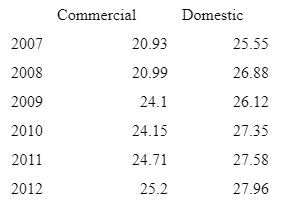
On the other hand, the electricity supply could be done commercially and domestically. From the commercial supply, the highest average could be noted in the year 2012 with a landing figure of 25.2 Terawatt hours and the lowest average would be noted in the year 2007 with a landing figure of 20.93 Terawatt hours. Domestically, the highest average would be realized in 2012 with a landing figure of 27.96 Terawatt hours while the lowest average would be noted in 2007 with a landing figure of 25.55 Terawatt hours. The behaviour of the electricity supply would be depicted below.
b. Data
Data analytics is critical because it helps companies maximize their results. Implementing it into the business model means businesses can help minimize costs by finding more effective ways of doing business and by storing vast volumes of data. An organization can also use data analytics to make better strategic decisions and help understand consumer patterns and satisfaction, which can contribute to new—and better—products and services (Vidgen et al., 2017).
The trends
For the trend analysis, it was important to focus on the behaviour of the gas and electricity supply over the years. The use of a trendline in the graphs would help in deriving a clear picture of the behaviour of the supplies over the years. The analysis started with the gas supply with the trend shown below.
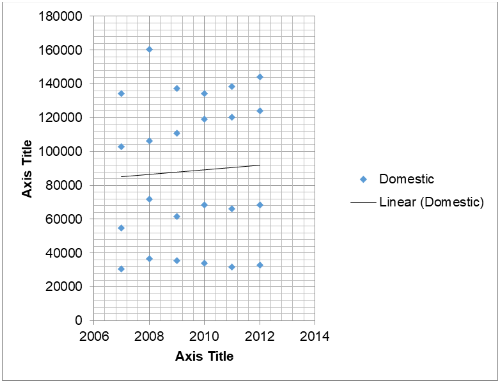
From the graph, it is evident that the quarterly gas supply kept increasing over the years. However, the trendline indicates the presence of outliers with figures indicating instances of extremely high and low consumption in some cases. Again, most of the figures would still appear below and above the trendline, which is something that indicates the chances of non-linearity in terms of the gas consumption. On the other hand, the analysis equally focused on the trend of the domestic and commercial electricity supply. The trend is as shown below.
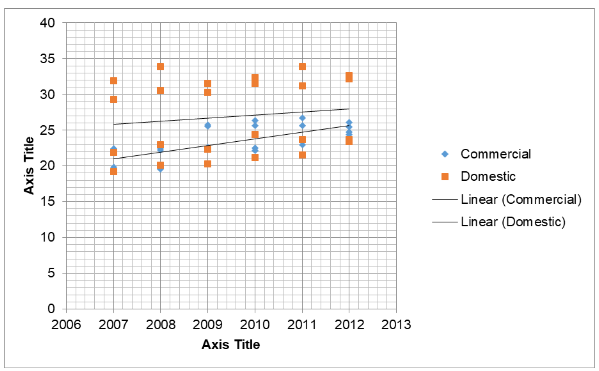
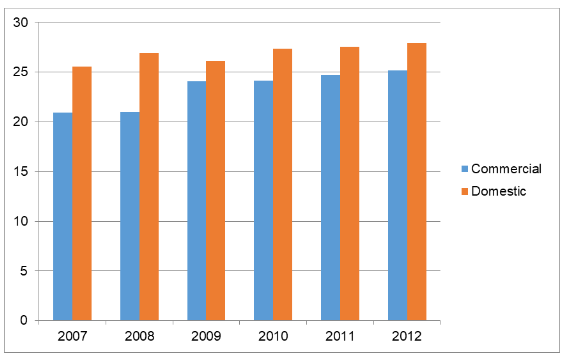
Both the domestic and commercial electricity supplies indicate an increasing trend that rises from the lower left end of the graph to the right upper end. However, the domestic electricity supply seems to be increasing at a higher rate compared to the commercial supply.
a. Time series
In any research task, the first thing to do is to track the data. Graphs allow for the visualization of various data features, including patterns, uncommon observations and time shifts, and the ties between variables (Appelbaum et al., 2017). The features seen in the data plots should be integrated into the prediction methods to be used as far as possible. Just as the data type defines the form to be used to forecast, it also determines which graphs are suitable (Pappas et al., 2018). A time series can be considered a list of numbers; along with details on the periods when those numbers have been registered. With the function ts (), one can transform this into a ts object: y ts(c(215.6,210.5,214.6,220.1), start=2012). Then by mapping against period, in this case year and quarterly measurement, for one or four observations per year (or the ending year). Adding frequency statement for findings more than once per year. If your monthly data, for instance, is already stored as a numerical vector z, then such an object can be converted to ts: y ts(z, start=2012, frequency=12). Using the data given, the trends of gas and electricity consumption over time, between 2007 and 2012, can be drawn. The gas and electricity (domestic and commercial) is drawn against time. From the Figure 1 below, gas sales shown in blue indicate a periodic rise and fail in a regular sequence. The highest sale occurs in the first quarter of each year then fall to lowest in the third quarter. From the Figure 1, the 1st quarter of 2008 had the highest gas sales (160,624 gigawatt hours) while the sales saw lowest sales was recorded in the 3rd quarter of 2007. As such, drawing from the trends where a periodic sequence of consumption, one can postulate the consumption trends and ways the consumers’ consumption behaviour. The 1st quarter of every year, the consumption ranged approximately 130,000 gigawatt hours, whereas, lowest stood approximately 30,000 gigawatt hours over the five year period.
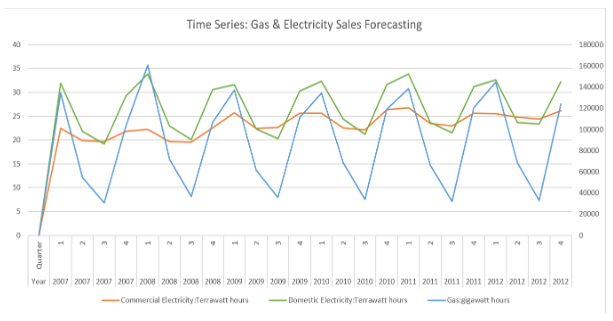
Similarly, the consumption trends of electricity domestic consumption showed identical trend as that of gas where its peaks in the 1st quarter then falling to lowest in the 3rd quarter. The highest electricity consumed was observed in 1st quarter of 2008 and lowest in 3rd of 2007. Comparing to gas consumption, although the highest and lowest differed, the domestic electricity consumption took similar trend of periodic rise and fall. However, the commercial electricity consumption remained relative steady over the same period, between 2007 and 2012. The consumption change over the year, across the four quarters, remained small with highest coming between 4th and 1st quarters while lowest consumption between 2nd and 3rd quarters.
Using the information inferred, a future prediction can be deduced. The goal is to approximate how the sequence of observations will continue in the future while predicting time series data (Ashrafi et al., 2019). For the next coming few years, the blue lines display predictions Note that for the forecast reported and repeated the seasonal trend seen in the historical results. 80% of the predictive intervals are in the dark shaded region. In other words, in the dark shaded field, each future value is expected to be 80%. 95% of prediction intervals are seen in the light-shaded region (Aydiner et al., 2019). Theoretically, these intervals of prediction are a good way to demonstrate prediction uncertainty. In this case, the projections should be correct and the forecast periods are therefore very restricted.
The simplest time-series predictive methods only use the variable information to be predicted and do not try to figure out the factors, which influence their behaviour. They thus extrapolate seasonal patterns and trends, but neglect all other details such as marketing campaigns, the activity of competitors, economic shifts and so on (Kraus et al., 2020). The analysis of time series is a statistical technique that deals with data from time series or trend analysis (Mikalef et al., 2020). Data from the time-series means that data is accessible in a variety of periods or intervals. Three types of data are considered:
b. Econometric
Econometrics means the use of statistical models and empirical data to quantitatively establish theories or test current economic hypotheses and to forecast historical data patterns for future trends. This includes statistical studies on real-world evidence and then compares and contrasts the findings with the hypotheses or theories being tested (Zhang & Chen, (2020). Econometrics can be subdivided into two main categories: theoretical and applied, depending on whether you'd like to test an existing theory or use existing data to establish a new hypothesis based on those findings (Griva et al., 2018). Econometrists are usually regarded as those who participate regularly in this profession. Under these conditions, managers in companies are seen as a powerful way to overcome competition in econometric applications and quantitative modelling. Econometric technologies offer organizations powerful tools to harness knowledge power and successful decision-making (Zhang & Chen, (2020). The application of economics includes the creation of mathematical/statistical models representing real-world economic processes, either in the economy as a whole, the industry or individual companies (Hindle & Vidgen, 2018). Econometric modelling is used to analyze complex market patterns (the demand function) to determine the variables which contribute to a product or service growth or decrease in demand (Griva et al., 2018). For the data given, utility consumption,
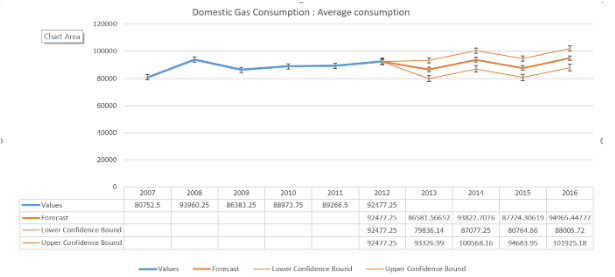
Using the econometric approach, one can map the current trends and then predict the consumption based on such variables as average, sum, minimum, and maximum value per year. Figure 2, show average gas consumption per year over a 5-year period and then a forecast of next 4 years.
Predictor variables and time series forecasting
In time series forecasting, predictor variables are also useful. For instance, assume that in the summer one need to predict the hourly demand for electricity in the heated area. A model of the ED=f form with predictor variables could be (current temperature, strength of economy, population, time of day, day of week, error). The relationship is not exact—changes in the electricity demand can always be produced, which the predictor variables cannot account for (Krishnamoorthi & Mathew, 2018). Random variance and the consequences of the related variables not included in a model can be achieved with "error" on the right (Conboy et al., 2020). This is a motive for justifying the reasons for the difference in demand for electricity. Since electricity demand data form a time series, a time series model may also be used for prediction.
A model of explanation is useful because it includes knowledge of other variables, not just historical values. But a predictor may select a time series model rather than an explanatory or mixed model for various reasons. First, the mechanism cannot be understood, and even if understood, the relationships supposed to guide its behaviour can be exceedingly difficult to quantify (Gunasekaran et al., 2018). Second, to predict the variable of interest it might be too complicated and need to know or predict the future values of the various predictors. Third, just predicting what is going to be done maybe the major issue, not knowing why. The time series model can provide more precise predictions than an explicatory or mixed model (Gunasekaran et al., 2018). The model to be used for predicting depends on the available resources and data, the precision of the competing models and the use of the forecasting model.
c. Additive forecasting or Multiplitive
Two types of data are available. One is additive, the product of adding numbers. This is considered. Such data appear to reveal a linear pattern. The other is multiplicative, which is considered to be the product of the percentage increase compounding effect. Such data appears to illustrate an exponential pattern (Hindle et al., 2020). And your sales data appear to look more like the latter when you are a growing company. And if you would like to preview these data, you wish to try the seasonality effect '‘Multiplicative.'
With a range of utility sales figures, one can construct a predictive model and try to compare and compare additive and multiply seasonal effects. The difference between the real (blue) and the predicted (orange) values is distributed over the years equally. In addition, this increases the consistency of the prediction model. The assessment metrics between the additive and multiplicative options can be compared. The metric models for the multiplicative model are better than the ones for the additive model.
d. Clustering
The task is to split the population or data points into several categories so that data points in the same groups are more similar than other data points in the same category. Simply stated, the goal is to isolate and assign groups with similar characteristics into clusters. In taking an gas consumption over the years, one can understand the customers' consumption behaviour then can model an strategy based on this trends (Nam, Lee, & Lee, 2019). Examining data and trends, one can come up this a data based plan. However, all customers in such categories based on consumption behaviours can be divided into groups and in each of these groups, then develop a consumer-focused strategy. This is known as clustering.
Types of Clustering
In general, it is possible to split the clusters into two sub-groups:
• Hard clustering: Each data point is either part of a cluster or not in hard clustering. For example, each customer is placed in a group from 10 groups in the example above.
• Soft Clustering: a probability of the data point in such clusters is allocated in soft clustering instead of placing every data point into a separate cluster (Vanani & Jalali, (2018). Each client is allocated, for example, likelihood from the domestic electricity consumption to fall below minimum threshold.

e. Conclusion
Good decisions often were the role of top managers that is no longer ultra (the highest point that can be achieved). To strengthen this purpose using the best economic techniques available, its foundations are not to weaken but to give them maximum power. The discussion above clearly shows that econometric applications can be used more and more in management and by managers in particular. Indeed, advanced econometric techniques provide the expected advantages. This game has only started with the expansion and the reliability of databases and the availability of new techniques and technologies. Managers or companies which are early movers will find new ways of improving their competitiveness in this sector. However, data is a vital part of decision-making. Data collection, assessment, interpretation and the information gathered to inform decisions using deferential techniques such as time series are included in the decisions Process.
Reference
Appelbaum, D., Kogan, A., Vasarhelyi, M., & Yan, Z. (2017). Impact of business analytics and enterprise systems on managerial accounting. International Journal of Accounting Information Systems, 25, 29-44.
Ashrafi, A., Ravasan, A. Z., Trkman, P., & Afshari, S. (2019). The role of business analytics capabilities in bolstering firms’ agility and performance. International Journal of Information Management, 47, 1-15.
Aydiner, A. S., Tatoglu, E., Bayraktar, E., Zaim, S., & Delen, D. (2019). Business analytics and firm performance: The mediating role of business process performance. Journal of business research, 96, 228-237.
Conboy, K., Mikalef, P., Dennehy, D., & Krogstie, J. (2020). Using business analytics to enhance dynamic capabilities in operations research: A case analysis and research agenda. European Journal of Operational Research, 281(3), 656-672.
Gunasekaran, A., Yusuf, Y. Y., Adeleye, E. O., & Papadopoulos, T. (2018). Agile manufacturing practices: the role of big data and business analytics with multiple case studies. International Journal of Production Research, 56(1-2), 385-397.
Hindle, G. A., & Vidgen, R. (2018). Developing a business analytics methodology: A case study in the foodbank sector. European Journal of Operational Research, 268(3), 836-851.
Hindle, G., Kunc, M., Mortensen, M., Oztekin, A., & Vidgen, R. (2020). Business analytics: defining the field and identifying a research agenda.
Kraus, M., Feuerriegel, S., & Oztekin, A. (2020). Deep learning in business analytics and operations research: Models, applications and managerial implications. European Journal of Operational Research, 281(3), 628-641.
Krishnamoorthi, S., & Mathew, S. K. (2018). Business analytics and business value: A comparative case study. Information & Management, 55(5), 643-666.
Mikalef, P., Pappas, I., Krogstie, J., & Pavlou, P. A. (Eds.). (2020). Big data and business analytics: A research agenda for realizing business value. Elsevier.
Nam, D., Lee, J., & Lee, H. (2019). Business analytics use in CRM: A nomological net from IT competence to CRM performance. International Journal of Information Management, 45, 233-245.
Pappas, I. O., Mikalef, P., Giannakos, M. N., Krogstie, J., & Lekakos, G. (2018). Big data and business analytics ecosystems: paving the way towards digital transformation and sustainable societies.
Vanani, I. R., & Jalali, S. M. J. (2018). A comparative analysis of emerging scientific themes in business analytics. International Journal of Business Information Systems, 29(2), 183-206.
Vidgen, R., Shaw, S., & Grant, D. B. (2017). Management challenges in creating value from business analytics. European Journal of Operational Research, 261(2), 626-639.
Zhang, C., & Chen, Y. (2020). A review of research relevant to the emerging industry trends: Industry 4.0, IoT, blockchain, and business analytics. Journal of Industrial Integration and Management, 5(01), 165-180.
Continue your journey with our comprehensive guide to Business Analytics Data Analysis Report.


- 24/7 Customer Support
- 100% Customer Satisfaction
- No Privacy Violation
- Quick Services
- Subject Experts