Enhancing Customer Attraction Strategies
Question 1
(a)
Here n = 20,000 customers;
P = 0.5% probability = 0.005
Individual price of the bike = £220
The target revenue is £25,000
Therefore, the total number of bikes that Hagkaup will need to sell is
(x) = 25,000/22 = 114
The company will have to sell 114 bikes to achieve the target revenue.
Mean (x̅) = n.p
= 20,000 * 0.005 = 100

p = 0.9251 = 92.51%.
(b)
p = 95% = 0.95
z = 1.605
z= x- x̅
1.605= x-100/9.975
16.0098=x -100
x=16.00+100
x=116
The mean should be 116.
Mean = n.p
116 = n * 0.005
n = 116/0.005=23, 200
Therefore the company will need to attract 23, 200-20, 000=3200

(c)
In order to achieve the target of attracting 3200 customers, the company should improve its marketing function. This will be useful in improving firms’ relations with the customers and to inform them about its products. Apart from this, the company should also invest in using traditional marketing mediums as well. Through these methods, the company would get a chance to thoroughly advertise its products among the target customers (Raghupathi and Raghupathi, 2014). In addition to this, it can also be suggested that the company should start referral programs, wherein the existing customers will be encouraged to bring in new customers so that they can avail discounts.
(d) 1
For men:
n = 7000
p = 0.007
Mean = x̅ = 7000*0.007 = 49
Individual price = £240
The revenue that needs to be generated is £12,000
Thus, the total bikes that need to be sold
x = 12.000/240=50

d (2)
For women
n = 15,000
p = 0.003
Mean = x̅ = 45
Individual price = £250
Therefore, the revenue that needs to be generated is £12,000
Thus the total bikes that need to be sold are:

= 48-45/6.70
p = 0.6700 = 67%
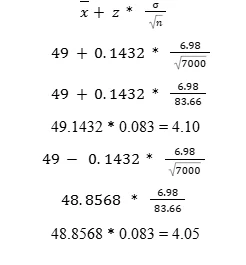
Confidence Interval for men

Therefore, confidence interval = 4.05 & 4.10
Confidence Interval for men

QUESTION 2
(a)
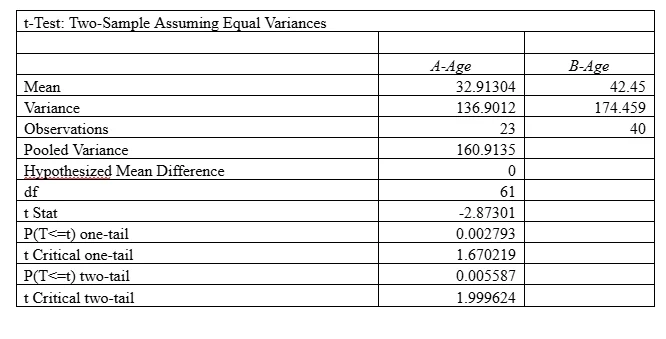
The mean age for Version A for started purchasing process was 33 years, and the mean age for design B was 42 years. This means that design A was liked more by the younger people, as it was modern and stylish. In addition, the below graph indicates that there were more people from Design B group who had started the purchasing process than those for design A. On the other hand, those who did not start the purchase process liked the design A than design B. On this basis, it can be said that the belief of the marketing director that simple website designs are more effective is true. It enabled more people to start the purchasing process early.

(b)

As per t-test, t(61) = -2.87; p = 0.000. This shows that there is a significant difference in the ages of the visitors that started the purchasing process in terms of the design of the website. The younger population liked the design A; while older people liked the design B. This can be evidenced that the mean age for version A that started the purchase process was 32.91 years and mean age for version B that started the purchase process was 42.45 years.
(c)
Other type of data that may be required by the management could be relating to website design of the competitors. This data would be important as it will help in understanding measures adopted by the rival companies and the changes that the company should make to its website’s design. Other than this, data regarding different characteristics and target customers would also help in determining the most suitable website design.
QUESTION 3
(a)
The following regression model can be used to forecast the profitability of Fjalla bank’s customers.
Y = β0 + β1 X1 +β2 X2 +…+ βk Xk + ε
Where Y = dependent (explained variable) Xi = ith independent (explanatory variable), i = 1, 2…k β0, β1, β2, β3…βk are the partial regression coefficients of respective independent variables. These are estimated using the least squares method from the input data. Thus, the model is as follows: Profitability = β0 + β1* online + β2 * Tenure + β3 * District Thus, the above model will determine the impact on online banking, tenure and district on the profitability of the bank.
(b)
On the basis of the below table, there is a positive relation between online customers and bank profitability, as the coefficient for online customers is positive. Therefore, it can be said that online customers are more profitable for the bank than offline customers. This can be supported through findings of Kambatla, Kumar and Grama (2014) who stated that banking firms are getting more business from customers through online channels, as it is more convenient and easy to use. This is further supported through the findings of Gandomi and Haider (2015), according to whom, ease of use as well as increasing dependency on online channels have made it a much better and desired option for banking firms. So, if all variables are kept constant, if the person is using online banking, the profitability will increase by 103.3049.

(c)
Yes customers in some districts are more or less profitable than in others by 1.88 times.
(d)
Profitability = -287.27 + 103.3049* online + 4.37418 * Tenure + 1.883516 * District
Profitability = -287.27 + 103.3049* 1 + 4.37418 * 15 + 1.883516 * 210
Profitability = -287.27 + 103.3049 + 65.6127 + 395.53836
Profitability = 277.08596
(e)
In the next step for the same analysis, it can be suggested to the bank that it should identify the customer demographics. This will be important because such data will inform the bank about its future target customers (Alexandrov and Naumann, 2014). By using this information, the management can develop future strategies and thereby make plans to ensure that its future functions are also carried out effectively while satisfying the demands of the customers in the most effective manner possible.
QUESTION 4
(a)
As per regression table and regression coefficient, R Square is coming out to be 0.81. This shows that with a 100% change in the independent variables, there will be 81% variation in housing starts. On the basis of the coefficient table, there is a positive relationship between the three quarters and housing starts, as their coefficient are positive.
(b)
Yes, as per the coefficient table, construction activities look seasonal as it remains almost similar in Q1 and Q3, but increases in Q2. Raghupathi and Raghupathi (2014) stated that construction is one of the activities that can be carried out almost throughout the year. According to Najafabadi, Wald and Muharemagic (2015) construction activities are significantly affected by the season, but not so much that they could have any significant impact on the activities as a whole.
(c)
The following is regression model:
Housing starts = 50044.354 – 7150.44 * Rates + 7610.47 * Q1 + 8918.27 * Q2 + 7646.57 * Q3
(d)
The goodness of fit is a model that describes how well it fits or suits the set of observations. By determining the goodness of fit, overall efficiency and effectiveness of a regression model can be determined. In order to test the suitability of the model measures such as a test of normality can be used (Kambatla, Kumar and Grama, 2014). Through such tests, the fit of the regression model can be determined, which will help in understanding the model as well as the results that will be obtained from it. In the given case, the R2 is used as a measure to goodness-of-fit and higher the value of R2 better the regression model fit. In the given case, the R2 comes out to be 0.81, showing a better goodness-of-fit.

(e)
Change in the t Stat would have affected the findings and the arguments significantly. If the t-state of Q3 has been reduced to 1.23 from 4.19, it means its coefficient would have also reduced and thus, Q3’s impact on housing starts would have decreased, thus, affecting the arguments of seasonality.
(f)
In such a scenario, the model could have adjusted in terms that the use of quarters as dummy variables would have been replaced by the use of year as another independent variable. (Alexandrov and Naumann, 2014).
REFRENCES
Alexandrov, A. and Naumann, F. (2014). The stratosphere platform for big data analytics. The VLDB Journal—The International Journal on Very Large Data Bases, 23(6), 939-964.
Gandomi, A., and Haider, M. (2015). Beyond the hype: Big data concepts, methods, and analytics. International Journal of Information Management, 35(2), 137-144.
Hu, H., Wen, Y., Chua, T. S., and Li, X. (2014). Toward scalable systems for big data analytics: A technology tutorial. IEEE access, 2, 652-687.
Kambatla, K., Kumar, V., and Grama, A. (2014). Trends in big data analytics. Journal of Parallel and Distributed Computing, 74(7), 2561-2573.
Najafabadi, M. M., Wald, R., and Muharemagic, E. (2015). Deep learning applications and challenges in big data analytics. Journal of Big Data, 2(1), 1.
Raghupathi, W., and Raghupathi, V. (2014). Big data analytics in healthcare: promise and potential. Health information science and systems, 2(1), 3.
- 24/7 Customer Support
- 100% Customer Satisfaction
- No Privacy Violation
- Quick Services
- Subject Experts


