FTSE100 Performance Amid Pandemic
Answer 1
The data for the April 2019 FTSE100 data is provided and below is the calculation:
Expected rate of return = (0.7x.02) + (0.2x.05) + (0.1 x -0.3)
= 0.12 or 12%

= 0.176352
= 17.63%
FTSE100 are the portfolio of top 100 companies who are trading in London Stock Exchange and are even also termed as London Stock Exchange Listed Companies. There are number of multi-national companies which are listed in exchange and trading globally. The pandemic disease Covid-19 have brought about major crisis and effect worldwide wherein effects are seen upon different sectors like economies, resources, government, etc. Prior to the pandemic, business used to take place normally by maximum output, use to attain revenues through divisions of foreign investments, delivery of the dividends to the shareholders and tax payment to the governments (Frantz & Payne, 2009). However, after the effect of Covid-19, the economy of the country has been affected negatively. The sales of the companies have reduced by 25% wherein companies are dealing with major loss. This effect is also seen in business giant named Coca Cola drink and beverages wherein company have faced a major loss and the production of the bottles have also slowed down due to decline in demands of the drink. Since, the global economies are linked with one another, so the spread of the virus have affected the economy wholly wherein prediction of the FTSE100 is not possible in the present situation. The total capitalization value of the market of top 100 London Stock listed Companies are termed as FTSE100. Meanwhile, London stock exchange is biggest stock exchange in world so those companies who are performing exchanges while performing business with different foreign companies and produce revenue and earn profit from the LSE. Because of the pandemic, there are various foreign companies which have got impacted largely and the earnings ratio of the FTSE100 companies have gone down drastically. It is seen that return from FTSE100 are lower as compared to results of previous year. As per the present scenario, it is seen that those airlines company and petroleum companies who are listed in FTSE100 are showing negative outcomes due to complete lockdown and closure of transportation facilities. In accordance with that, pharma companies and hospitals are showing better performance due to increase in demand of the medicines and health check-ups. It can thus be stated that almost every activities of economy have got creased, there is decline in demands of goods and prices of the products have fallen sharply wherein stock exchange of its return have also gone down.
Answer 2
The Coca-Cola HBC is considered as third largest anchor bottle company in the world globally. There is requirement of larger amount of money to execute its work as it is a manufacturing company. The cash which are invested in the company either arrives through borrowing from banks or by profits generated by the company. The self-generated profits are not affected but the cash borrowed is impacted by the share prices, dividend ratio, beta factors and other related areas. Beta factor is highly linked with business wherein also plays an essential role in the stock exchange market. There are 3 types of categorization which are termed below:
Beta>1: indicate an aggressive beta
Beta=1 indicates a neutral beta
Beta<1: Indicates a defensive beta
Aggressive Beta stated that company are ready to implement risk.
Neutral beta means that company is executing its operation normally by either taking extra risk and defense.
Defensive Beta reveals that company is not in a mood to take risk and want to execute its operation safely.

Covariance = measure of stock's return relative to that of market
Variance = Measure of how the market moves relative to its mean
The Beta of Coca-Cola HBC is 1.26, which reveals it is aggressive in nature.
The expected market return premium is 10%
Risk Free rate is 0.1%
There are number of methods to measure the returns which are expected but Capital Asset Pricing Model (CAPM) are used widely and is accepted. It is a way to take our link between expected return and risk associated with investment security. It is one of the methods that are used to measure returns. The formula for CAPM are stated below:
RA = Risk free Rate + [ Beta x (RM – Risk free rate)]
Where,
Rfr = 0.1%
Beta = 1.26
Rm = 10%
RA = 0.1% + [ 1.26 x (10% -0.1%)]
= 12.58%
This method is amazingly effective in usage which eradicate the unsystematic risk and apply only systematic risk into consideration. There are number of methods to measure the returns but out of which capital Asset Pricing Model is applied widely and are accepted in the sectors of finance. This method is used as it give accurate outputs and it is termed as factors of markets to measure the required return (Frantz & Payne, 2009).

Answer 3
This question is regarding the measure of the optimal weight allocation by the means of risk-free return. This method possesses number of steps such as expected return by Capital Assets pricing Model and risk aversion degree is 2 as stated in the question. According to the question, calculation of the optimal weight allocation can be performed by means of risk-free return. By the means of CAPM and Risk aversion degree, the expected returns are calculated which are as follows.
RA = Risk free Rate + [ Beta x (RM – Risk free rate)]
= 0.1% + [2 x (10% - 0.1%)]
= 19.9%
Although, there are emergent of various portfolio theories, the modern portfolio theory means founding the ways by which inventors evaluate the investments of money, enhance return also decline the influence of the risks of the market. The investors do not make an investment on one company wherein they play a safe game and safeguard oneself from major loss. After reviewing the investor’s behavior, various financial experts have developed theories so that investors can make its investment in any company without any fear. Although, many economists have brought about various theories into action, however, Harry Marlowitz was the one who developed Modern Portfolio Theory. The main structure of this theory is the investor who are planning to make investment in systematic manner and are taking risk to enhance its return and decline risks. Diversification is another criterion which is applied in financial institution to decline the risk. It is linked with investors who try to make investments in various sectors so that if one company have a failure than only small amount of investments of investors gets lost and increment in other company’s investments brings about balanced portfolio(Bradford & Miller, 2009). Some of the portfolio theory apart from modern portfolio theory is Traditional Approach theory. This theory is an old theory which possess Dow Theory which reveals stock prices movement. Dow theory is further divided into three major reactions that includes primary reaction, minor movement/reaction, and secondary reaction. Each of these category and types state the movement and its influence on the stock market. The primary reaction means the movement which are in nature of long term and stay 1-3 years. The influence of such category is higher and have direct impact on the stock market as it influences the stock market up and down. Secondary market means the correction theory type which brings about corrections in the impact which are provided by the primary movement. Lastly, minor movement are self-explanatory and does not have any impact on the stock market. The nature of this type is noticeably short (Bradford & Miller, 2009). Random Walk Theory is the old theory which is essential which means that stock market brings about changes up and down significantly and for few days. This Walk theory is not predictable and any information which are linked to shares are spread in the market and because of which the price of share is regulated.
Optimal Portfolio
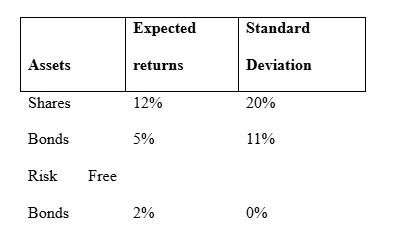
Degree of risk aversion 2
Correlation coefficient 0.3
Calculation of excess expected return of each risky asset.
E{R} = E[r] - rf
E[Rd] = 0.05-0.02
= 0.03
E[Re] = 0.10
Calculate the weights of the optimal risky portfolio
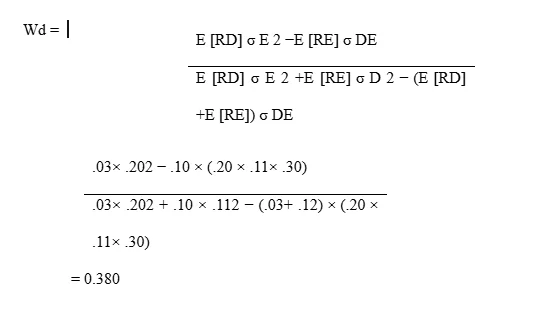
Calculate the expected return and standard deviation for the optimal risky portfolio.
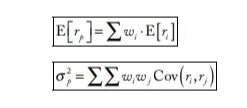
E [ rp] = 0.38 x 0.05 + 0.62 x 0.12
= 0.0934
σ p 2 = 0.382 × .112 + .622 × .202 + 2 × .38 × .62 × (.20 × .11× .30)
= 0.0202
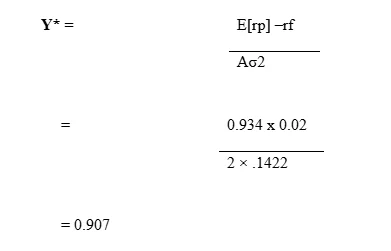
Calculate the allocation to the optimal risky portfolio, based on the investor’s degree of risk aversion.
Answer 4:
Coca-Cola HBC Ltd is a Switzerland linked company which is listed in London Stock Exchange listed company and 3rd largest anchor bottle for the Coca-Cola Company. It is also listed in Athens, Greece which is the secondary listing. The company make its operation in various countries, but it is originally present in Athens, Greece. When the company moved to Switzerland than it was listed in the London Stock exchange.
Calculation of Ratios:
Price/Earnings Ratio

Dividend Discount Model Valuation approach

These is the calculation for the year end on 31/Dec/2020. Because of the Covid-19 pandemic, almost every companies globally are facing decline in their rate of growth. So, it is assumed that there is decrease in 15% for year end on 31/12/2020.


Covid-19 pandemic situation have affected the global economy wherein every sector has got affected drastically. People have lost its jobs, decline in purchasing power and have decreased the trends of the company. There are estimated calculations provided for next five years growth.
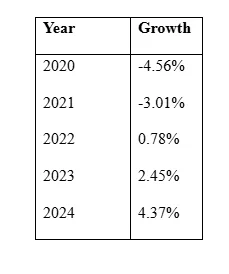
If Covid-19 Pandemic situation have not taken place, then there would have been better growth in industries. The calculated growth rate would get altered every year because of economic factors, etc.

Answer 5
Financial Market
Financial market is the places wherein one buy and sell trade securities such as shares, derivatives, bonds, etc. like normal market where different type of goods and services are purchased and sold. However, financial market is not found everywhere and are found in physical manner in some of the financial cities of country. However, one can get access to the services by the means of internet. This market deals with such securities at lower costs of transaction. The financial market is the indicator of the health of economic world whereon it deals with financial securities of company. It is indicated that when company perform in an effective manner than its impacts are also seen on the financial market (Schneeweis, Crowder & Kazemi, 2010). The trading in the market of finance does not reveals that this market also deals with securities such as shares, bonds, derivatives but it also deals with foreign exchanges and commodities such as crude oil, silver, gold and also metals such as zinc, iron, copper, etc.
Real Economy development
It is a term that which means economic growth of country which possess industrial growth, manufacturing growth, agricultural growth, service sectors growth, etc. The Real economy growth of economy are calculated as Gross Domestic Product Percentage wise contraction or growth. The Gross domestic Product is a calculation of measurement of country’s economic values. GDP is the gross value of product and services which is generated by the country every year wherein values get changed every year. GDP are of two types which includes Real GDP and Nominal GDP. Nominal GDP are used to compare all economies of the world which includes inflation effects, foreign exchange effects, purchasing power parity effects and interest parity effects. On the other hand, Nominal GDP is the method that calculate the economy of specific country which does not make comparison with other countries. It is seen that due to pandemic created by the Covid-19, the economy of the world has declined as compared to the previous situation. When one is explaining regarding link between financial market along with real economic development that it is seen that performance of financial market plays major role in the growth of real economy. For an instance, if a company attain its target and make its performance effectively than its effects could be reviewed in financial market with the enhancement in price of share, boosts up the confidence of the investors by which reserve of the country are enhanced. The efficient market hypothesis states the easy by which stocks react to the force of market. The efficiency of market means the degree by which the price of market showcases the information. When the market is effective than each of the data could be attained from stock’s process. It is the reason that there are no securities wither undervalued or overvalued are present. Thus, efficiency of the market can be acknowledged as market’s ability to add information which helps in giving opportunities to the purchasers and sellers and is termed as right market (Schneeweis, Crowder & Kazemi, 2010). EMH reveals that investors will perform its action randomly even if the orientation and situation of market is right. There are mainly 3 forms of efficient market hypothesis stated below:
Strong EMH: It reveals that each of the data is costs as stocks and none of the investors could attain benefits over the market. This EMH type possess simple logic wherein data are prices in stocks and each of the investors attain same benefits. This market is strong, and no discrimination is done with the investors (Arcand, Berkes & Panizza, 2015).
Semi-strong EMH: This type reveals that investors cannot attain benefits from either technical or fundamental analysis. It assumes that new public information is absorbed by the market wherein investors could not attain advantage on new data. This type state that technical analysis and fundamental analysis cannot be applied to attain extra returns as data attained will be incorporated in present prices (De Gregorio & Guidotti, 1995). Only information which are private and not present in market are helpful to attain advantage in the business sectors.
Weak EMH: This type of EMH states that those data that are taken from past are not useful to predict the price of future. In this EMH, the excess returns are not possible whereon fundamental analysis assists the investors to attain higher than market returns. The fundamental and technical analysis would be ineffective in long term analysis wherein past performance does not give certainty of the future outcomes (Arcand, Berkes & Panizza, 2015).
References
Schneeweis, T., Crowder, G. & Kazemi, H., 2010. The new science of asset allocation: Risk management in a multi-asset world. Hoboken, NJ: Wiley & Sons.
Ross, S. Westerfield, R. & Jaffe, J., 2002. Capital market theory: An overview. Corporate finance (6th ed.) (226-247). New York, NY: McGraw-Hill.
Bradford, J. & Miller, T., Jr., 2009. A brief history of risk and return. Fundamentals of investments (5th ed.) (1-37). New York, NY: McGraw-Hill.
Frantz, P., & Payne, R., 2009. Corporate finance. Chapter 2. London: University of London Press. Arcand, J.L.; Berkes, E.; Panizza, U., 2015. Too much finance? Journal Economic of Growth, Vol. No. 20, No. 7-10, pp. 105–148.
De Gregorio, J. & Guidotti, P.E., 1995. Financial Development and Economic Growth. World Development, Vol. No. 23, pp. 433–448
- 24/7 Customer Support
- 100% Customer Satisfaction
- No Privacy Violation
- Quick Services
- Subject Experts


