Equity Valuation Methods for Tesla Inc
1. Introduction
The stock market trading is being emerged as the most popular option of investment through which an individual can manage its investment within an organisation. In the context of contemporary investment environment, the financial performance of a company plays an important role in influencing the market prices of shares. This report is going to investigate different aspects of financial performance analysis through which an individual investor is able to make appropriate investment decisions related to ‘buy, sell, or hold’ (Copeland, Copeland and Copeland, 2017). In this regards, this study evaluates the financial performance of Tesla Inc. in the form of stock market trends, financial statements, ratios analysis and also applies three equity valuation methods to determine the value of the business entity. Tesla Inc. is a leading American Company which is offering a range of innovative products and services in the form of the electric car, clean energy solutions, solar panels, and many more. Company has built a great reputation in the field of science and technology (Tesla Inc, 2020).
2. Overview of Financial Performance of Tesla Inc
2.1 Share Price Trends
It is one of the most important indicators of financial performance that offers significant assistance to stock market traders in their investment decisions.
As per the above chart, there is stable growth identified in the stock price of Tesla Inc. between the periods of 2015 to 2019. In 2015, the share prices were floated near to 250 USD, and the company recorded similar trends in 2016. Furthermore, the business entity recorded the average value of stock near to 300 USD during the period between 2017 and 2018. However, the share price of Tesla Inc. was reduced to 190 USD in 2019. In 2020, Tesla has gained significant boost-up in the market value the share which is reached to 748 USD in February 2020. Therefore, it can be stated that the company is maintaining upward trends in the share prices in the last two months that would support investor in the assessment of capital gains (Anesten et al., 2020).

2.2 Evaluation of Current Market Statistics
In the context of current market trends, Tesla maintains strong growth in the total assets that the market capitalisation of the company is reached to 134.84 Billion USD. The five year beta of Tesla Inc. is 0.56 (Tesla, Inc. (TSLA), 2020). Furthermore, the total number of outstanding shares is reached to 180.24 Million. Moreover, the price-to-book ratio and price-to-sales ratio is respectively 20.37 and 5.40 (Tesla Inc, 2020). According to financial statements of Tesla, the business entity has not announced any dividend because it has not attained profit targets in an appropriate manner. In addition to that, the negative profit figure encourages negative earnings per share (EPS) so as P/E ratio cannot be calculated (Pinto, 2020).

Continue your journey with our comprehensive guide to Corporate Disclosure and Market Valuation.
2.3 Assessment of the Last Five Years Financial Performance
Key Elements of Financial Statements

In the context of financial performance analysis, the above chart shows a significant change in the total assets of Tesla. In the last 5 five years, the organisation has made a considerable investment in its assets to enhance overall business efficiency. The growth rate in 2016 was the highest in five years because Tesla was increased its total assets by 180%. These figures show a strong business position in the company.

As per the above chart, it has addressed that business entity has maintained stability in the revenue growth. In 2018, the growth in revenue was highest because Tesla recorded revenue growth of 82%. Therefore, continuous growth in the revenue can be considered as an appropriate indicator of a strong market position.
Looking for further insights on Mortgages and Land Charges? Click here.

The assessment of financial statements of Tesla determines stable growth in revenue. However, the above chart indicates that the business entity has filed to attain profit goals in the last five years. In 2017, the organisation recorded the highest loss of 1834.9 Million USD. On the other hand, strong growth in 2018’s revenue has helped the company in order to manage strong recovery in the loss. These trends indicate that Tesla will attain positive profit figures in the upcoming years.
Key Financial Ratio

The above chart determines the profitability of Tesla for the last five years. In the context of gross profit margin, business is showing negative trends because the gross earning of the company is reached to 18.33% in 2018 as compared to 27.57% of 2014. Tesla has made a huge investment in the research and development along with high-end technologies so as there are significant fluctuations identified in the operating profit margins. In 2015, Tesla recorded the negative operating margin of -7.27%. Further improvement in operational efficiency leads to a positive impact on operating profit, and it was reached to 8.43% in 2018. However, a business entity cannot attain positive profit figure in the last five years. The percentage of net loss was highest in 2015. In 2018, the percentage of net loss was lowest (-3.46%) that can be termed as an important indicator of strong financial recovery.

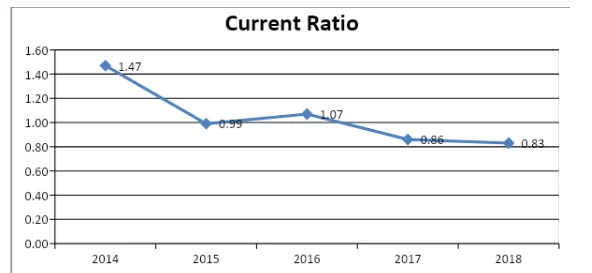
The current ratio is considered as an important indicator of the liquidity position of an organisation. As per the above chart, Tesla has recorded downward trends in the current ratio which is reached to 0.83 in 2018 as compared to 1.47 of 2014. However, the company has not attained the ideal current ratio of 2:1 in last five. With reference to the current ratio of the business entity, Tesla finds some issues in the attainment of current liabilities because the organisation does not have appropriate current assets.

As per the above chart, the business entity has addressed negative figures in the return on assets and return on capital employed because Tesla has recorded loss in all five years.

The above chart presents the cash conversion cycle of Tesla, in which company has recorded downwards trends in the last five years. The cash conversion cycle of Tesla is reached to 10.90 in 2018 in comparison of 50.28 of 2014. These figures have indicated that Tesla is growing its operational efficiency in order to covert its investment in cash flow. Therefore, it can be stated that the business entity will maintain significant growth in its revenue through appropriate cash conversion cycle (Smith and Gibbs, 2019).

In the financial statements, Tesla has recorded a loss in financial results in the last five years. Therefore, the above chart shows negative earnings per share in all years. However, the business entity has maintained a better position in 2018.

As per the above chart, company has addressed downward trends in assets turnover ratio till 2016 but organisation has recorded significant growth in the assets turnover during the period of 2017 and 2018 that is respectively 0.41 and 0.72. In 2018, the increment in revenue of Tesla has seemed like an important driver that increases assets turnover ratio. These data indicate that the total asset of Tesla improves its efficiency in order to maintain positive trends in revenue growth.

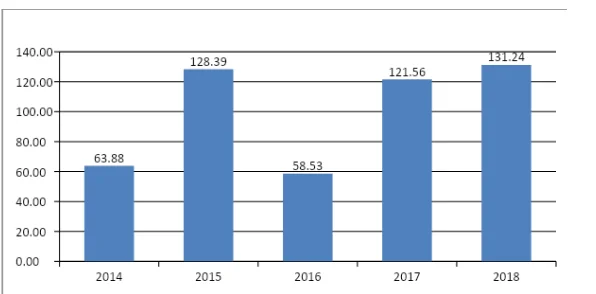
As per the above diagram, Tesla has maintained upwards trends in debt-equity ratio. This is because the business entity acquires more funds in the form of debt as compared to equity capital (Raut, Das and Mishra, 2018). The debt-equity ratio of Tesla for the period of 2018 is reached to 131.24. However, the increase in debt capital increases the liabilities and expenditure of the business entity because an organisation has to pay a certain amount of interest that lowers its profitability.
3. Application of Different Equity Valuation of Method
3.1 Net Assets Value (NAV)
For assessing the value of the company, the net assets value (NAV) method offers significant support to investors (Chen and Chen, 2016). In the case of Tesla, there have not any adjustment identified so as the total value of assets mentioned in the balance sheet of 2018 is considered as net assets value. The net assets value of Tesla is 29739.6 Million USD.

3.2 Price-earnings Ratio (P/E Ratio)
According to financial statements of Tesla, the company has recorded a loss in the financial performance that leads to negative earnings per share. Therefore, the calculation of equity value based on the P/E ratio cannot be carried out.

3.3 Comparison of Findings
The current market value of Tesla’s share is 748 USD, and a total number of outstanding shares is 180.24 Million so as the total market value of equity capital of reached to 134819.52 Million USD (Tesla Inc, 2020). There is significant difference identified in the equity of the company that has been calculated based on net assets value and discounted cash flow. The comparison of different results has found that the market value of equity capital of Tesla is significantly higher than its net assets value and equity value of based discounted cash flow.

4. Conclusion
As per the above assessment, this report has concluded that an individual investor can any select any option from the ‘hold’ and ‘sell’ while managing the investment in Tesla’s shares. This is because the assessment of the financial performance of Tesla has found that the company has not attained the profit targets in an appropriate manner. However, the business entity has maintained strong growth in the assets along with its revenue. These figures have a lead positive impact over the market value of shares because the organisation has recorded significant increment in share prices within the stock market. Therefore, existing shareholders of Tesla have an opportunity to assess the benefit or profit by selling the shares of Tesla at high prices or they can hold the shares for the future capital gains.
Reference
- Anesten and et.al., (2020). The pricing accuracy of alternative equity valuation models: Scandinavian evidence. Journal of International Financial Management & Accounting, 31(1), 5-34.
- Chen, T. L. and Chen, F. Y. (2016). An intelligent pattern recognition model for supporting investment decisions in stock market. Information Sciences, 346, 261-274.
- Copeland, M., Copeland, T. and Copeland, T. (2017). Revising Equity Valuation with Tail Risk. The Journal of Portfolio Management, 43(4), 100-111.
- Raut, R. K., Das, N. and Mishra, R. (2018). Behaviour of individual investors in stock market trading: Evidence from India. Global Business Review, 0972150918778915.
- Smith, C. M. and Gibbs, S. C. (2019). Stock market trading simulations: Assessing the impact on student learning. Journal of Education for Business, 1-8.
- 24/7 Customer Support
- 100% Customer Satisfaction
- No Privacy Violation
- Quick Services
- Subject Experts


