Telecommuting vs. Office Work: Employee Exhaustion Study
1. Introduction & Literature review
This report aims to find out whether employees working from home (treatment group) are more or less exhausted in relation to counterparts working at office (control group) at a travel agency firm. To do so, a descriptive statistic for relevant variables in the data, outline of the correlation, hypothesis testing to compare the statistical difference between exhaustion mean and the average treatment effect will be carried out via a regression analysis. Additionally, recommendation whether the firm should implement a policy will be given based on the outcome of the analysis of this randomised experiment data.
The traditional working practices that includes solely working from work place and its impact on performance has changed over the last few decades due to a rise in telecommuting as a management practice. For instance, according to Global Workplace Analytics, over 25 million within the US carry out their work duties through telecommuting whereas around the world it is estimated to be between 11-30% (Gallup, 2017). Allen et al defines telecommuting as work practice that enables employees to carry out a portion of their work at home (Allen et al., 2015). Telecommuting is distinguished for its capacity of improving work-family balance, autonomy, job satisfaction, declining travelling time, turnover and stress (Allen et al., 2015). This is evident as a study carried out by Bloom et al found that those in treatment group faced less work exhaustion (Bloom et al, 2015). Additionally, gender is considered as a clear determining factor of telecommuting as females are to choose telecommuting to keep their time flexibility for childcare (Bealanger, 1998).
Moreover, Bloom et al, 2015 randomised experiment on a Chinese leading travel agency Ctrip call centres in Shanghai analysing the impact of satisfaction level on control and treatment found that those working at home were 16% more satisfied. Additionally, treatment group performance level rose by 13%, worked 9.2% more due to lack of commuting and short breaks whereas their exhaustion level declined. However, it is critical to stress that treatment group promotion opportunities were lower in relation to their counterparts (Bloom et al, 2015).
The hypothesis testing for this report is:
- • H0 – Working from home does not affect exhaustion
- • H1 – Employees working from home are less exhausted than employees working at the office.
2. Descriptive Statistics
As highlighted in the table 1, within the treatment group 45.95% of the population are male compared to 49.12% in the control group whereas 22.97% in the treatment are married compared to 31.58% in control. Additionally, 9.46% of the population in the treatment group have children when compared to their counterparts with 26.32%.
Table 1:Demographic Information and Descriptive Statistics of the Treatment and Control Group Population.


Moreover, the average age of the population is 24 (ranging from 18-34 years old) tenure varying from 2 to 96 months whilst the average salary is 3.114586 as outlined in table 2. Additionally, the overall average exhaustion (dependent variable) score is 8.32 (table 2), ranging from 0 to 36 whereas the standard deviation of 7.94 outlines that the data is closely clustered around the mean as shown in table 2. The descriptive statistics used to compare mean average exhaustion score between two groups shows a trend that treatment group score is lower when compared to the control. For instance, the average mean exhaustion score of the control group is 10.51, higher in relation to the treatment group with 6.62 as the figure 1 highlights. Additionally, employees with children in the treatment score lower as their average score is 6.63 (with children) and 6.63(without children) whereas in control the average score is 9.16 and 11 respectively see appendix 1.
Dig deeper into Production Technology and Efficiency in Education Sector with our selection of articles.
Table 2: Continues Variables Descriptive Statistics
- Variable Mean Std. Dev. Minimum Maximum Exhaustion Score 8.32 7.974093 0 36
- Age 24 3.517847 18 34
- Monthly Salary 3.114586 .8414331 1.38759 6.220746
- Tenure 29.82061 23.21717 2 96
- Total Number of Observations 5,109
Notes: The table above outlines the central tendencies and variation of continues variables within the sample. The exhaustion score ranges from 0 to 36, age from 18 to 34 whereas the average time that employees have been working at the firm is 28 months, which varies from 2 to 96 months.
Source: Data is based N. Bloom, Liang, J., Roberts, J., Ying, Z.J. Does Working from Home Work? Evidence from a Chinese Experiment, The Quarterly Journal of Economics, Volume 130, Issue 1, February 2015, Pages 165-2018.
Figure 1: Overall Exhaustion Score Between Control and Treatment Group
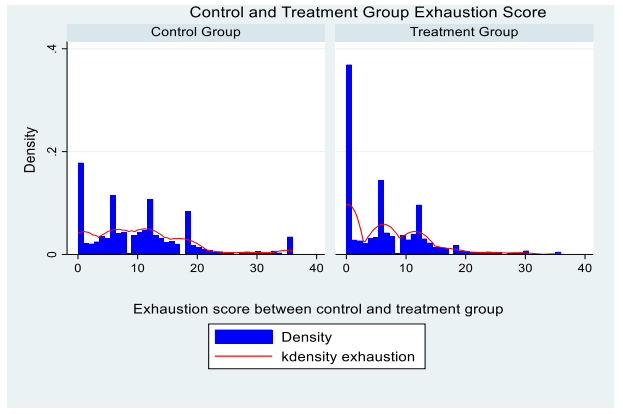
Notes: The figure 1 outlines the exhaustion score between the control and treatment group. The score ranges from 0 to 36 whereas the left side of the histogram shows the score of the treatment group, the right shows of the treatment group. Based on the histogram, high percentage of low exhaustion score, for instance 0 is registered within the treatment group. Thus, outlining the lower distribution of low score within the treatment group.
Source: Data is based N. Bloom, Liang, J., Roberts, J., Ying, Z.J. Does Working from Home Work? Evidence from a Chinese Experiment, The Quarterly Journal of Economics, Volume 130, Issue 1, February 2015, Pages 165-2018.
Furthermore, taking marital status into account, those married in both groups have lower mean score in relation to counterparts. The average score for those married is 4.68 in relation to 7.20 single (treatment group) whereas in the control group, those married scored 9.01 in relations to single 11.20 in their group as outlined in table 3. Similarly, women in the treatment scored an average of 6.07, men with 7.27 whereas those working at the office women (10.18) and male counterparts (10.82) scored higher as outlined in table 4.
Table 3: Descriptive Statistics of Exhaustion score between Control and Treatment Group Based on Marital Status

Notes: This table shows the exhaustion score of single and married employees within both groups. Those working at home scored lower mean exhaustion score in contrast to the control group. For instance, married employees in the treatment scored 4.68 with a standard deviation 5.34(not that dispersed from the mean) in whereas the control scored 9.01(std of 8.87). It is critical to stress that the N for married in treatment is lower when compared to the control group.
Source: Data is based N. Bloom, Liang, J., Roberts, J., Ying, Z.J. Does Working from Home Work? Evidence from a Chinese Experiment, The Quarterly Journal of Economics, Volume 130, Issue 1, February 2015, Pages 165-2018.
Table 4: Descriptive Statistics of Exhaustion score between Control and Treatment Group based on Gender
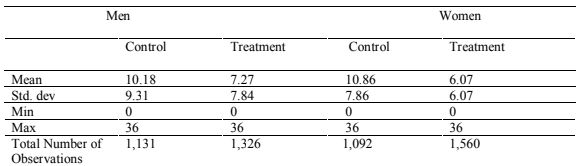
Notes: This tables outlines the exhaustion mean score between men and women in treatment group and control group. Both men (9.31) and women (6.07) in the treatment scored lower in relation to their counterparts in control with 10.8 and 10.86 respectively. The std dev (6.07) for women in treatment is very clustered around the mean, the men in the treatment group follow the same trend, std dev (7.84) clustered around the mean whereas in the control it is a bit disperse but moderate closer to the mean (std. dev of 7.86 and mean is 10.86) whereas men is closer with 9.31 std. dev.
Source: Data is based N. Bloom, Liang, J., Roberts, J., Ying, Z.J. Does Working from Home Work? Evidence from a Chinese Experiment, The Quarterly Journal of Economics, Volume 130, Issue 1, February 2015, Pages 165-2018.
3. Association between Exhaustion and other Numerical Variables: Correlation Coefficient
To assess the relationship between exhaustion score and other numerical variables (table 5), correlation analysis was carried out at 0.001 significant level. Prior the test, the team assumptions and expectation tenure were that variables such as tenure and gross wage would be positively correlated with exhaustion whereas the outcome is, that commute is negatively correlated and there is significant with other variables at the level provided. However, it is critical to stress that this is not controlled for other factors.
Table 5: Correlation between Exhaustion and other variables
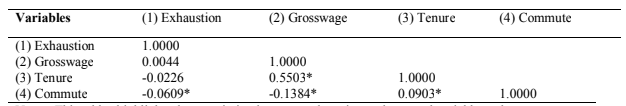
Notes: This tables highlights the association between exhaustion and numeral variable such as grosswage, tenure and commute at a 0.001 significance level. Commute is the only statistically significant association with exhaustion at 0.001 level, however negatively correlated. As highlighted above, it is paramount to stress that this is not controlled for other factors.
Source: Data is based N. Bloom, Liang, J., Roberts, J., Ying, Z.J. Does Working from Home Work? Evidence from a Chinese Experiment, The Quarterly Journal of Economics, Volume 130, Issue 1, February 2015, Pages 165-2018.
4. Hypothesis Testing
To check for balance between both groups’ ex ante (2010 week 49), as highlighted in table 6 an independent samples t-test shows that overall exhaustion mean score for control (7.49) and treatment (5.78) are different, however not statically significant at 5% as the p-value is 0.10.
Table 6: Independent Samples T-Test for Continues Variables Before the Experiment: Checking for Balance


Notes: This table shows the mean difference exhaustion score between both groups a week prior the experiment, in this case week 49, 2010. This was carried out to check for balance and check whether they were statistically significant in mean exhaustion score between both groups prior the experiment. As highlighted by table 6, mean exhaustion score for the control group ex ante is higher in relation to their counterparts in the treatment group. This is because the treatment group showed and reported high positive attitude towards telecommuting as they learned that they would be working from home (due to randomisation) a week prior the experiment starting whereas the control group showed opposite attitude due to being informed that they would be (randomisation) working at the office (Bloom et al, 2015
Source: Data is based N. Bloom, Liang, J., Roberts, J., Ying, Z.J. Does Working from Home Work? Evidence from a Chinese Experiment, The Quarterly Journal of Economics, Volume 130, Issue 1, February 2015, Pages 165-2018.
Moreover, testing the statistical significance of differences in mean exhaustion score in the treatment group (prior the experiment in week 49 of 2010 and during in 2011 week 35) via a paired samples t-test as highlighted in table 7, shows a rise in exhaustion score from 5.78 to 6.20. However, it is not statically significant at 5% due to P-value 0.26. One can argue that including only the treatment group and exhaustion variable whilst excluding the control group (exhaustion level could also be rising in control group) and background factors such as children, marital status, gender and tenure in the test could have contributed to the mean outcome. Conversely, when control group and treatment are tested via an independent samples t-test during the experiment (week 35, 2011 compared to prior week 49 2010), there is wider rise in mean exhaustion score for the control group from 7.49 (table 6) prior to 10.35 (rise by 2.86) whereas the treatment experienced only of 0.42 from 5.78 (table 5) to 6.20. The overall mean exhaustion score is statistically significant at 5% as the P-value is 0.0012. Thus, we reject the null hypothesis H0 and support the alternative hypothesis that working at home decreases the exhaustion level.
Table 7: Paired Sample Test of Treatment Group Exhaustion Score Before and During the Experiment

Notes: This paired samples t-test shows the outcome of mean exhaustion score of the treatment group prior the experiment (week 49, 2010) and during the experiment (week 35, 2011) to test the significance in mean exhaustion score. As highlighted in the main text, there is a difference in mean exhaustion score which rose from 5.78 to 6.20, however not statically significant at 5%. One can assume that not including the control group and excluding other variables led to an increase in the mean outcome. Thus, a regression analysis will be required at regression analysis section 5.
Source: Data is based N. Bloom, Liang, J., Roberts, J., Ying, Z.J. Does Working from Home Work? Evidence from a Chinese Experiment, The Quarterly Journal of Economics, Volume 130, Issue 1, February 2015, Pages 165-2018.
Table 8: Independent T-Test: Control and Treatment Group Exhaustion Score During the Experiment Week 35, 2011
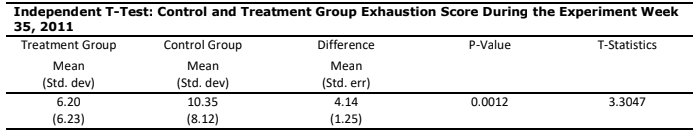
Notes: This table outlines the significance difference in means between control and treatment group during the experiment week 35, 2011. Looking at table 8, as outlined, the exhaustion score for the treatment group only rose from 5.78 to 6.20 whereas those in the treatment group experienced a larger rise from 7.49 to 10.35. This is statically significance at 5%, thus we reject the null hypothesis and support the alternative hypothesis that working from home decreases the exhaustion level. The standard deviation for the control group is 6.20 and 8.12 treatment group.
Source: Data is based N. Bloom, Liang, J., Roberts, J., Ying, Z.J. Does Working from Home Work? Evidence from a Chinese Experiment, The Quarterly Journal of Economics, Volume 130, Issue 1, February 2015, Pages 165-2018.
5. Regression Analysis
Due to limitations of t-test, a regression analysis is carried out to test the overall model and assess the effect of control variables on dependent variable, in this case exhaustion. Additionally, as control variables are added to model, R-squared rose from 6% (model 1) to 13.8% (model 3), outlining the percentage of variation in exhaustion within the model (see table 9). Also, the overall model is significant due to variations in F-test and its null P-value.
Moreover, the average treatment effect of telecommuting in the treatment group is a -2.238 (DID) decrease in exhaustion during the experiment which is significant at 5% level and it is
consistent across the three models due to randomisation as highlighted in table 9. Conversely, the treatment group registered a higher average exhaustion score of 3.105 at a strong 1% significance level in relation to the treatment group, outlining positive effect of the treatment for those working at home. Thus, based on the outcome, we reject the H0 and support the alternative hypothesis that working from decreases exhaustion. Bloom et al, experiment also found that those in treatment group faced less work exhaustion while telecommuting (Bloom et al, 2015). Additionally, in all three models, the standard error of the estimator does not decline as most of the added control variables do not explain exhaustion. For instance, in model 2, commuting has a small effect (a decrease of 0.016) on exhaustion level at 10%, married (effect on exhaustion) employees experienced a decrease of 3.385 at 1% thus benefiting the most from telecommuting whereas those that volunteered to work at home, telecommuting decreased their exhaustion score level by 3.328 at 10%. In model 3, married women experienced a decrease of 5.513 in exhaustion at significance level of 5% whereas its standard error is 2.316 (large) due to a decrease in N. This is evident as according to Bealanger gender is considered as a clear determining factor of telecommuting as females are to choose telecommuting to keep their time flexibility for childcare (Bealanger, 1998).
6. Conclusion & Recommendation
Based on the outcome of the overall report analysis, one can argue that telecommuting reduces exhaustion level and the average treatment effect in exhaustion in the treatment population is a decline of 2.23 in exhaustion score at 5%. On the contrary, those at control group experience an average score of 3.105 at strong 1%, thus supporting the alternative hypothesis that working from home decreases exhaustion levels. Therefore, the firm should consider implementing telecommuting as a permanent management practice policy. However, it is critical to stress that the firm should focus on employees or subgroups (heterogeneous effects) that benefited the most from this experiment such as married employees with a strong a 1% significance level, married women, those that commute long distance as a reduction in exhaustion could motivate, thus improving productivity and help the firm save office related daily expenses.
Table 9: Exhaustion Regression table: General Effects

This table outlines the three regression model including mode 1(showing the treatment group, the experiment and DID the average effect of treatment) , model 2 (consists of control variables which when holding everything else constant or ceteris paribus only marriage, commute and volunteering affect the exhaustion variable) and 3(marriage women are the only variable effecting the exhaustion score) affect the exhaustion score at the respective levels outlined in section 5.
Source: Data is based N. Bloom, Liang, J., Roberts, J., Ying, Z.J. Does Working from Home Work? Evidence from a Chinese Experiment, The Quarterly Journal of Economics, Volume 130, Issue 1, February 2015, Pages 165-2018.
7. Reference List
- Allen, T., Golden, T. and Shockley, K. (2015). How Effective Is Telecommuting? Assessing the Status of Our Scientific Findings. Psychological Science in the Public Interest, 16(2), pp.40-68.
- Bélanger, F. (1999). Workers' propensity to telecommute: An empirical study. Information & Management, 35(3), pp.139-153.
- Bloom, N., Liang, J., Roberts, J. and Ying, Z. (2015). Does Working from Home Work? Evidence from a Chinese Experiment*. The Quarterly Journal of Economics, 130(1), pp.165-218.
- Golden, T. and Eddleston, K. (2019). Is there a price telecommuters pay? Examining the relationship between telecommuting and objective career success. Journal of Vocational Behavior, [online] p.103348. Available at: https://doi.org/10.1016/j.jvb.2019.103348 [Accessed 16 Nov. 2019].
- Harvard Business Review. (2019). Is It Time to Let Employees Work from Anywhere?. [online] Available at: https://hbr.org/2019/08/is-it-time-to-let-employees-work-from-anywhere [Accessed 16 Nov. 2019].
- L.L.C. Gallup (2019). State of the American workplace: Employee engagement insights for US business leaders Washington, DC. Retrieved on March 16, 2019. Available http://www.gallup.com (2017)
8. Appendices
Appendix 1: Descriptive Statistics of Exhaustion score between Control and Treatment Group Based on those who have Children

Notes: This table outlines the mean exhaustion score between those with children in control and treatment group. The mean exhaustion score of those with and without children in the treatment group treatment is 6.66 and 6.63 whereas in the control it is 9.16 and 11.00 respectively.


- 24/7 Customer Support
- 100% Customer Satisfaction
- No Privacy Violation
- Quick Services
- Subject Experts