Practical Statistical Analysis

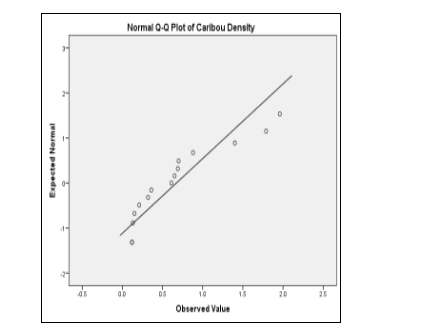
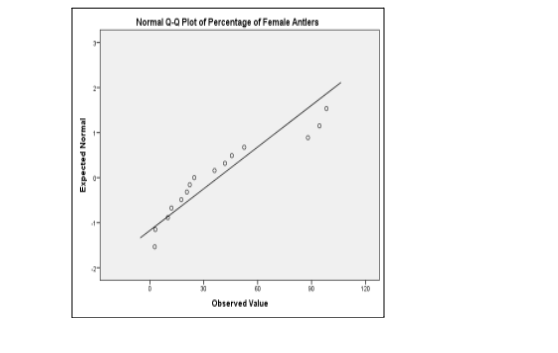
A scatter plot to show linear relationship between the two variables was performed and found that there was a weak negative linear association between the two variables as shown in figure 1. A test to verify normality using a Normal Q-Q plot of the variables shown in figure 2 shows that the scatter of points seem not to lie along the straight line, thus the points forms a non-linear pattern around the normality line thus the data appear to be non-normally distributed with possible Skeweness. If you need further assistance, seeking statistics dissertation help can provide additional insights into analysing these patterns effectively.



As shown in figure 4, upon transformation, the data set for the Log (Percent female antlers) appeared to have attained normality since the scatter points appeared to fall along the straight line of normality. On the other hand, we observe in figure 5 that, despite the transformation of the data set for the Caribou density, Normality was not achieved as the data points appeared to have a non-linear pattern around the straight line of normality.
The main differences that resulted from the transformation of the data set is that the scatter plots of the two variables showed a weak negative linear association in the original data set whereas a positive linear association between the predictor and the indicator variables in the transformed variables. Also noted is that the normality of the transformed data set for the percentage of female antlers improves as compared to the original data set.
On the other hand the similarity between transformed and the original data set is that the transformation of the Caribou density does not in any way improve the normality of the data set as shown in figure 2 (right) and figure 5 respectively where the data points form a non-linear pattern around the straight line of normality.
Continue your exploration of Robot-Assisted vs. Freehand Spinal Surgeries with our related content.
Since not all data sets fulfill the normality assumption, therefore parametric tests would not be applicable thus we would resort to apply non-parametric test. We are to test the hypothesis that the two data samples are independent therefore since the non-parametric test failed, we apply Spearman’s correlation test for association. (i.e. to determine whether two samples are independent). H0: There is no association between percentage female antlers and the caribou density (Mathematically: Spearman’s rho=0) H1: There exists a significant association between percentage female antlers and the caribou density (Mathematically: Spearman’s rho≠0) Spearman's Correlation between exists a significant association between percentage female antlers and the caribou density.

A Spearman's rank-order correlation was performed to find out if there exists a significant association between the log transformed data sets of percentage female antlers and the caribou density. As shown in the table 1 above, the two variables recorded a significant strong, positive correlation. The null hypothesis that the two data sets are not associated is rejected at alpha 0.05. Based on the analysis in part (ii), we can conclude that there exists a strong association between the percentage female antlers and the caribou density. Based on the correlation coefficient, we have that; as the percentage female antlers increases, the density of the caribou significantly decreases.
We are to test whether the species diversity between the two zinc concetration levels are Normally distributed. Therefore the null and the corresponding hypotheses are: H0: The distribution of diversity is assumed normal H1: The diversity of species is not normally distributed.

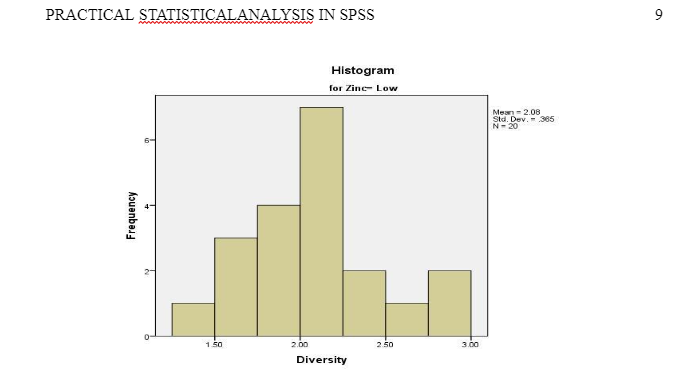

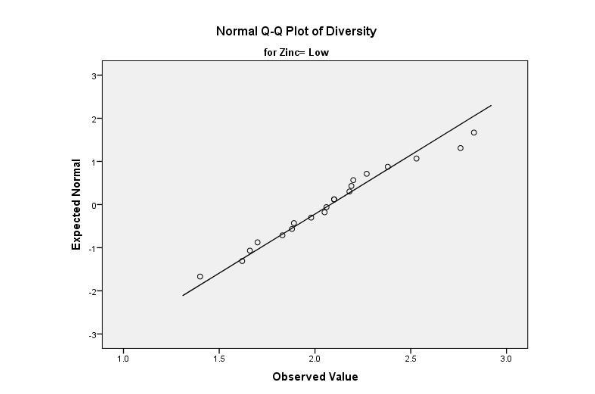
A Shapiro-Wilk’s test for normality yielded a statistically insignificant with a test statistic of 0.975 (p=0.85) and 0.946(p=0.495) for the low and high zinc concentration respectively, thus the conclusion that null hypothesis that the distribution of diversity in the two levels of zinc concentration is not rejected at 0.05 level of significance. This conclusion of normality is supported by the histogram shown above in Figure 6 and the Q-Q plots for the same represented by Figure 7, where the data points are clustered along the straight line with an exception of two and one outlier(s) in the low and high zinc concentrations respectively.
Since we have an independent variable stream which has more than two independent groups, the dependent variable diversity is a continuous variable; there exists no significant outliers as shown in the Figure 7; and the dependent variable has been confirmed as normally distributed as per part (a) above. Therefore, a one-way ANOVA is valid to determine if there are significant difference in diversity by streams (blue, Snake and Splat).

Based on the analysis output presented in Table 2 above, we have that the a significant difference between the mean species diversity between the three streams with as shown in the ANOVA table (F (2,31) = 11.04, p 0.001). Since the p-value is considerably small, we reject the null hypothesis and conclude that indeed the concentration of species diversity in the three streams is different.

To further compare how the species diversity differed in the three streams, a Tukey-post-hoc test revealed that the species diversity was statistically insignificant between blue and snake (-0.219 ± 0.238, p=0.62) and whereas there was a significant difference between blue and spat (-1.055 ± 0.238, p 0.001). Thus we can conclude that based on the statistical data analysis there was no significant difference between species diversity blue and spat p = 0.62 We formulate the hypotheses as: H0: Mean species diversity in low zinc concentration is equal to mean species in high zinc concentration. H1: Mean species diversity in low zinc concentration is NOT equal to mean species in high zinc concentration.

In order to perform the paired t-test, we confirm that the data set meets crucial assumptions: The dependent variable is measured in a continuous scale, the independent variable has two categories (low and high), normality of the dependent variable as confirmed in part (b) above, the homogeneity of variances is confirmed by the Levene’s test for equality of the variances (F=10.622, p=0.003). As shown in Table 3, species diversity for low zinc concentration (M=2.08±0.082) was not significantly different from those in the high zinc concentration (M=2.01±1.04) t(32) = 0.265, p = 0.793. Therefore we fail to reject the null hypothesis and conclude that there was no significant species diversity between zinc concentrations.
The response variable is the number of fish species, which is influenced by the predictor variable, the lake area. We begin by determining what kind of statistical test by interpreting the question in which we are to determine if there is a relationship between fish species richness and lake area. The corresponding hypotheses are: We perform a Spearman’s correlation test for association and test the hypothesis at 0.05 (5%) level of significance.

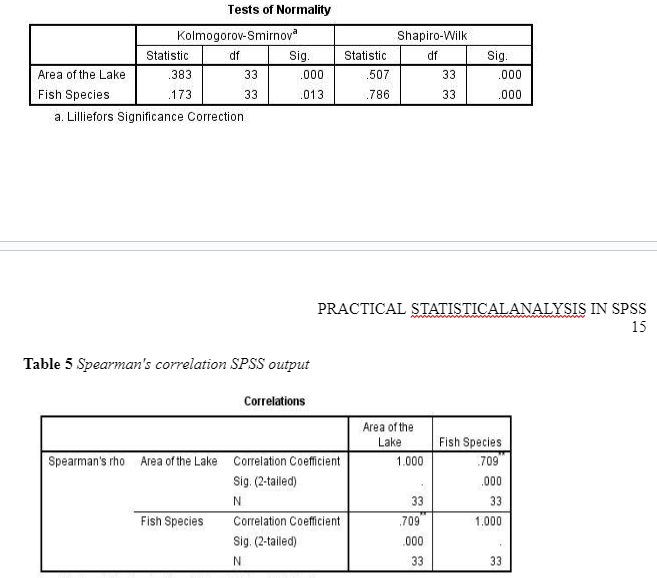
Since the test of normality by the use of Shapiro-Wilk test of normality showed that there is a significant difference in the distribution from the normal for the fish species since the test statistic 0.507 and 0.786 with a p-values 0.001. Since the assumption of normality failed, we resort to non-parametric test, for this case Spearman’s test of correlation to determine the association between the two variables. The Spearman’s-order correlation test (see Table 5), of association and relationship resulted in a test statistic, therefore we reject the null hypothesis at and conclude that there is enough evidence that the fish species richness is positively correlated with the lake area which means that as the lake area increases so does the fish species in it. In order to determine the kind of test to apply for the transformed data set, we begin by determining whether the normality assumption is met or not. We conduct the Shapiro-Wilk test of normality in which we have the null hypothesis( distribution of the variables are normal) and the test statistic as 0.943p=0.084 and 0.933p=0.044 for,we therefore fail to reject the null hypothesis and conclude that the data can be assumed normal at 0.01 level of significance.


Since the normality is assumed, we can apply parametric test for the test of association between the in this case we apply the Pearson’s moment correlation, r. The null and the alternative hypothesis are given as: H0: There is no association between (Mathematically: Spearman’s r=0) H1: There is an association between (Mathematically: Spearman’s r≠0)
We performed a Pearson product-moment correlation to establish the existence of a linear association relationship linking. Based on the analysis output in table 6, it was established that there was a statistically significantly moderate weak positive correlation between the two variables (r = 0.490, n = 33, p = .004). The decision rule would be to reject the null hypothesis at the given 0.05 significance level and we conclude that as the area of the lake increases so does the number of fish species.

We performed a Pearson product-moment correlation to establish the existence of a linear association relationship linking. Based on the analysis output in table 6, it was established that there was a statistically significantly moderate weak positive correlation between the two variables (r = 0.490, n = 33, p = .004). The decision rule would be to reject the null hypothesis at the given 0.05 significance level and we conclude that as the area of the lake increases so does the number of fish species.
The differences in the type of tests applied in the analysis in parts (c) and (d) is that the former is a non-parametric also known as distribution free test and does not make any assumptions about the distribution of the data. On the other hand, the test in part (d) is the most reliable and strong test, the parametric test since normality assumption of the data set is emphasized.

The null and alternate Hypothesis H0: We assume that there exists no association between the place of residence and baldness. The two variables are independent. H1: We assume that there is a significant association between baldness and the place of residence. Thus the two variables are assumed to be dependent. In order to test the hypotheses formulated above, we performed a chi-square test of independence to determine if there exists a statistically significant difference and the results are presented in table 8 below. The relation between baldness and residence appeared to be significant (). The decision rule would be the rejection of H0 that the two variables are not


In order to determine the cell with the highest contribution, we calculate the corresponding residuals. The cells with the largest residual values have the greatest contribution to resulting chi-square (Agresti, 2007). Thus from table 9, we have cell London /bald having the highest contribution.

Since the confidence intervals of the rainfalls differ and do not overlap, therefore there is a significant difference in rainfall in those two cities Atlanta and Miami.


As Shown in the Multiple comparison table (post-ANOVA test) and also supported by the comparison bar graph, there is a significant difference between Mexico and California with the mean difference of 17.12, p=0.025 which is significant at 0.05. However Mexico and Venezuela and Venezuela and Carlifornia seem to have similar leaf area at the 0.05 significance level.
The most appropriate test to be used would be Chi-Square Goodness-of-Fit Test, this is because all the assumptions for the test are met which are: We have categorical variable employment type with employment groups that are mutually exclusive. The second assumption would be that the observations must be independent and there should be no relationship between any two or more cases since the job requirements and tasks are assumed to differ significantly then the second assumption holds.
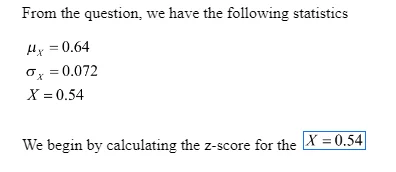
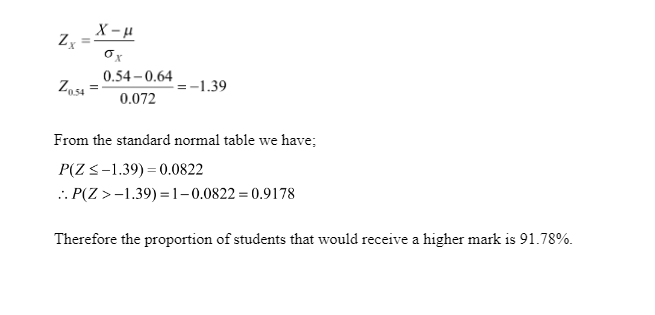
A sample standard error provides a measure of how well a sample mean approximates the population mean and the statistic used is the z-score. The other measure is the student t-score.
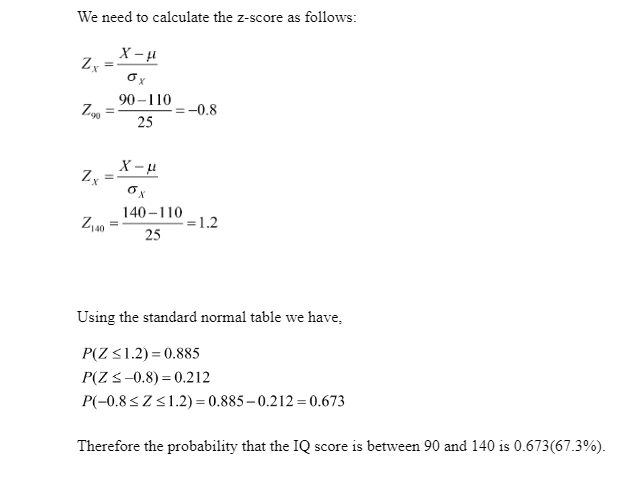

The conventional alpha value in ecology is 0.05 which is above or below the mean.

References
- Agresti, A. (2007). An introduction to categorical data analysis. Hoboken, NJ: Wiley.
- Statistics.laerd.com. (2015). Statistical Analysis in SPSS - procedure, output and interpretation of the output using a relevant example. Accessed from:[Accessed onFriday, January 12, 2018].
Take a deeper dive into Practical Application of Two-Factor ANOVA with our additional resources.
- 24/7 Customer Support
- 100% Customer Satisfaction
- No Privacy Violation
- Quick Services
- Subject Experts


