Predicting Work Productivity: A Study on Game-Related Internet Behaviors in Tech Companies
Purpose of the Study
The purpose of the current quantitative multiple regression study was to test explanatory values of the predictor variables; employee game-related Internet behaviors, gender and age, on the response variable; employee work productivity in technology-oriented companies in Finland. Two surveys provided information on the predictor and response variables in the current study. The respondents answered questions about demographics, personal game-related Internet behavior, and work productivity. For those seeking guidance, quantitative dissertation help can be beneficial in navigating complex analyses. The focus of this chapter was to examine whether employee game-related Internet behavior, together with gender and age, can be used to make predictions related to employee work productivity within the technology-oriented companies.
Research Question
Previous research has not established if a relationship existed between employee game-related Internet behavior and work productivity in the IT industry in Finland. However, many studies attempted to explore in the areas of organizational productivity, employee Internet behavior, and employee work productivity (Carlson, Zivnuska, Harris, Harris, & Carlson,2016; Grover, 2014; Moody & Siponen, 2013). Generally, the aim of those studies was to explore individual theories and the way some other specific factors impacted those theories. Not many studies attempted to explore other multi-factor impacts or relationships on each of the variables that were under investigation in the current study.
The current study took place in the IT organization at technology-oriented companies in Finland. A single overarching research question provided direction: How much of employee work productivity is explained by the level of employee game-related Internet behavior and demographic variables (gender and age) in technology-oriented companies in Finland?

Hypotheses
The use of null hypotheses was useful in making predictions that there exist no relationships among predictor and response variables (Pereira & Gavin, 2009). The alternative hypothesis is in contrasts to the null hypothesis and may be true if the null hypothesis is rejected (Pereira & Gavin, 2009). Alternative hypotheses were essential in the current study because the researcher had predicted a relationship between predictor and response variables in the population of IT employees working in the technology-oriented companies. A regression analyses was run to test hypotheses 1 to 3.
H10: Game-related Internet behavior is not significant predictors of employee work productivity across technology-oriented companies in Finland.
H1A: Game-related Internet behavior is significant predictors of employee work productivity across technology oriented companies in Finland.
H20: Game-related Internet behavior and gender are not significant predictors of employee work productivity across technology-oriented companies in Finland.
H2A: Game-related Internet behavior and gender are significant predictors of employee work productivity across technology-oriented companies in Finland.
H30: Game-related Internet behavior and age are not significant predictors of employee work productivity across technology-oriented companies in Finland.
H3A: Game-related Internet behavior and age are significant predictors of employee work productivity across technology-oriented companies in Finland.
Data Collection Procedures
The population for the current research study consisted of a random sample of 142 technology employees in Finland who were willing to participate. The aim was to collect data from a random sample of 200 technology employees in Finland. The survey was launched an online survey in May 2016 on SurveyMonkey.com to obtain the data for the current study.
The online tool from SurveyMonkey.com sent the survey electronically to the participants. Only completed surveys were conducted and used for the data analysis. A completed survey consisted of a survey that was filled or answered by a participant and sent to the researcher through SurveyMonkey.com.
Sample
The current study sampled employees from four companies willing to have their technology employees participate and these companies are representative of the larger population of IT companies in Finland. The accessible population for the current study included IT consultants, software analysts, developers, programmers, and testers who belonged to technology-oriented companies in the IT industry in Finland. Potential participants received a recruitment email through the SurveyMonkey.com, including screening questions based on the inclusion and exclusion criteria and for each person sampled who was excluded randomly sampled another from the appropriate list based on the company.
Continue your journey with our comprehensive guide to The Impact of Technology and Globalization on Retail Strategies.
As said, IT professionals were contacted via email, using email lists owned and provided by four technology companies willing to have their employees participate. Potential participants were asked to participate in the survey. The participants who failed or refused to check screening questions or that they needed to agree to the terms of the informed consent form could not participate in the survey. Although this approach may expose the sample selection to possible biases, non-probability sampling might be the only viable alternative when the total population is not available for sampling (Bezzina, & Saunders, 2014; Cooper & Schindler, 2008). This was the case of IT professionals in Finland because no public registers exist to identify these individuals.
The main online survey had five parts. The first section part Letter of Introduction (Appendix A) and the second part was Informed Consent Form (Appendix B) in electronic form with a full disclosure screen with two selection buttons. The participants could either press the button to give permission and continue or press the other button to exit the survey. The first part also provided directions to complete the survey. The third part included questions about demographic information (Appendix C). The fourth part included the OGS questionnaire (Appendix D), 16 questions asking game-related Internet behavior as the participant perceived it. The fifth part included the EWPS questionnaire (Appendix E), 25 questions asking for the participant’s perceptions of his or her work productivity.
The participants who failed or refused to check screening questions in the Letter of Introduction (Appendix A) or that they needed to agree to the terms of the Informed Consent Form could not participate in the survey. In all, 142 participants responded to the survey. However, 120 out of the 142 study participants passed screening questions and transmitted finished surveys including agreeing to the terms in the informed consent form, for processing and analyses. Hundred and twenty participants represented 60% (120/200) response rate. However, it was impossible to know how many of the entire population did meet the screening criteria and thus 60% response rate was not likely fully accurate. The reason for inaccuracy was some of the participants did not reply at all because they did not meet the screening criteria or they did not want to respond.
Furthermore, some participants opted out without even clicking on the Consent Form. When a completed survey was submitted, the software inherent in the system processed results as they were received. The research 120 consenting participants finished responses for the data analysis, which is within an acceptable range according to power analysis. All study participants withhold IT job position in a technology-oriented company in Finland, had been working more than three months in the company and did not have supervisory responsibilities.
Pilot Study
The Online Gaming Scale (OGS) instrument was a self-administered Likert-type scale survey instrument, which contained survey items to measure employee game-related Internet behavior. A pilot study determined the reliability (internal consistency) and validity of the (OGS) instrument, which was launched on www.suverymonkey.com. Prior to administering the survey, the panel of 21 experts (pilot sample), who did not participate in the main study, were drawn from individuals who shared similar characteristics to the target population to test the content validity of the survey. The survey instrument was administered online. Completion of the survey was dependent upon the target population’s willingness to participate in the study.
The content validity analysis is the statistical process of evaluating a new survey instrument to include all survey questions that are essential to the study and eliminating all items that are not important to the research. As such, the OGS survey was evaluated by a panel of experts consisting of software analysts, developers, programmers, and testers to assess the importance of the survey questions in assessing respondents’ game-related Internet behaviors. The expert panel review and pilot study led validity to the OGS.
The OGS instrument was emailed to the pilot study participants through SurveyMonkey.com and data collection period was one week. The reminder of the pilot study was sent to participants after four days, and the third reminder was sent after six days if not all 21 had responded. After the collection of the study data, a factor analysis was conducted. Cronbach’s alpha derived from establish internal consistency for the current online gaming scale of the OGS. From a single test administration, Cronbach’s alpha coefficient estimated the test-score reliability using the correlation data among test items (Rao & Sinharay, 2007). The overall internal consistency of the 16 scales of the OGS was α = .93, which was an acceptable coefficient for reliability (Creswell, 2002). The response rate for the pilot test was 100%.
Preliminary Analysis
The purpose of this preliminary analysis was to provide descriptive statistics rather than answer the research questions. This preliminary analysis provides information about participants such as gender, age, and employee game-related Internet behavior. This section also provides the response rate information. The preliminary analysis used the data collected from the participants who passed screening questions, acknowledged and agreed to the informed consent and findings of employee game-related Internet behavior and work productivity as per gender and age.
The preliminary analysis used the data collected from the participants who acknowledged and agreed to the informed consent in writing and participated in the survey (n = 120). The Statistical Package for the Social Sciences (SPSS v24) to produce descriptive statistics such as mean, mode, kurtosis, range, standard deviation, the means for coding and tabulating scores. The use of tables and graphs was for depicting the results of the survey.
Constructing Composite Variables
The aim of the current study was to test the explanatory values of the predictor variables employee game-related Internet behavior, and demographics variables; gender and age, on the response variable, employee work productivity in technology-oriented companies. As the composite variables of employee game-related Internet behavior and work productivity were the main measures of interest, and the distributions of these variables were approximately normal, the composite score for each variable was calculated. The scores were the values of the variables, game-related Internet behavior and work productivity, as measured on those instruments using two online Likert-type survey questionnaires combined into one survey. The calculation method of the composite score was that the OGS and EWPS scales scores were composite scores for the items on the scale. Each composite score was a numeric value computed by summing the items that make up the scale.
The demographic items (Appendix C) included questions about participant’s gender and age. The investigation of employee game-related Internet behavior started with the Online Gaming Scale (OGS), designed by the researcher (Appendix D). The OGS was a scale developed and tested for the current study to measure employee game-related Internet behavior at the work place as self-reported by employees. There were 16 items and each measured on a 5-point scale with 0-never; 1-seldom; 2-sometimes; 3-often; and 4-almost always. The OGS score is calculated by the composite score. Individual OGS scores ranged from 0 and 64, with 0 being the lowest level of gaming behavior and 64 being the greatest level of gaming behavior.
There were 25 items, and each was measured on a 5-point scale with 0-never; 1-seldom; 2-sometimes; 3-often; and 4-almost always. The EWPS score is calculated by the composite score. The EWPS scores ranged from 0 and 100, with 0 meaning item in question had no impact on employee productivity level, and 100 meaning item in question had the highest impact on employee productivity level. The rating was used to see how often the behavior, feeling, or attitude has occurred.
All 200 participants received an email invitation from the SurveyMonkey.com to participate in the survey. All who passed the letter of introduction’s screening questions based on the inclusion and exclusion criteria and accepted the terms got the access to the main survey. Of these 200 employees, 142 accepted the invitation and received the access to the main survey.
Three factors contributed to missing data: participants failed in screening questions or refused to check that they agreed to the terms of the informed consent form, or did not answer all questions. In cases where a participant either failed in screening questions or chose not to participate could not participate the survey. Whereas, a participant did not answer one or more questions that comprised one of the OGS or EWPS scores, only the scores from the answered questions were averaged to define the employee game-related Internet behavior or work productivity.
In the OGS and EWPS questionnaires, four participants did choose not to answer at all. In the OGS questionnaire, 1 participant did not fully respond, and his or her response was dropped because it was not complete. In the EWPS questionnaire, three participants did not fully respond and their responses were dropped because they were not complete. There was one participant did not fully respond to the OGS and EWPS questionnaires, and his or her response was dropped because it was not complete. There was also one participant whose answers were the same for all the questions, and his or her response was dropped. After the cases with missing data had been dropped, only 110 out of 200 responses remained, which would result in a response rate of 55% (110/200) across all four variables. Invalid responses were those including any unanswered question (blank). The analysis excluded all the invalid responses. The complete data set included 110 cases, and all analysis was conducted using the complete data set.
Reliability of Measures
In the preceding sections of the preliminary analysis, the Likert-type scale was used. Thus, it was imperative to use reliability coefficient to calculate and report Cronbach’s alpha coefficient for the OGS. This scale included items from predictor variable employee game-related Internet behavior.
To assess the internal consistency of the items which made up each one of the constructs of this study, Cronbach’s alpha coefficients were calculated. These values were similar to those Pearson’s correlation coefficients, except that they range from a value of zero up to + 1. A value of + 1 would indicate a strong reliability or consistency between the items that made up each of the constructs. This strong consistency would indicate that the items could be combined to give an overall measure of the desired construct of interest. Because the items on the questionnaire were ranked in terms of a 5-point Likert scale, the scores received for each one of the items that make up the construct could be summed to give an overall measure of that construct. In this case, a higher score would indicate a high level of employee game-related Internet behavior and lower employee work productivity.
If the Cronbach’s alpha score was observed to be around or close to zero, it could be concluded low reliability or consistency between the items that make up the construct. In the social sciences, .70 or higher is generally the accepted α value for items on a scale (Garson, 2008). SPSS v24 produced the values for Cronbach’s alpha. Two constructs are the Online Gaming Scale (OGS) and the Endicott Work Productivity Scale (EWPS) and are shown in Table 2, including the scale name (Construct), Cronbach’s alpha (α); a measure of scale reliability, standardised alpha and number of items in the scale.
Results from the reliability analyses revealed that both scales were sufficiently reliable. This conclusion was reached because the OGS’s Cronbach’s alpha score was equal to 0.96 and the EWPS’s Cronbach’s alpha score was equal to 0.96, which were greater than the 0.70, which is a general rule of thumb according to Lance, Butts, & Michels (2006). The item scores for each item were summed to provide an overall measurement of adaptability. Table 6 depicts summary statistics from the reliability analysis conducted on the two constructs.
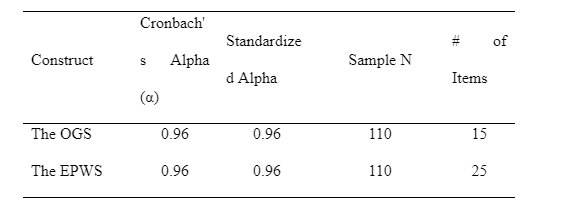
Cronbach’s alpha is an effective measurement of the reliability of a questionnaire (Keller & Kros, 2011). Correlations are a measurement of the relationships between two variables. Thus the most efficient way to measure the reliability of the relationship is Cronbach’s alpha (Connelly, 2011). In order to compute Cronbach's alpha, the basis is the number of items on the surveys and the ratio of the average inter-item covariance to the average item variance. The 15-item configuration scale for the first question is comprised of the variables of the OGS. That is, for the 15-item Online Gaming scale (OGS), Cronbach’s alpha was calculated at .96, for the 25-item the Endicott Work Productivity Scale (EWPS), Cronbach’s alpha was at .96.
However, a correlation matrix in Cronbach’s alpha’s reliability analysis indicated strongly to remove the item #5 (Think you are comfortable working offline?) because it had a negative correlation with all other questions in the questionnaire. It is typical to remove the variables, which have a lack of correlation with each other because they cannot predict a change in a response variable to the extent they should. However, this should have been caught during the pilot and before the data collection and not after. Conceptually, it does not make sense to keep items that are not measurements of the OGS. Thus, the item #5 was removed from the raw data before the primary data analysis.
Findings
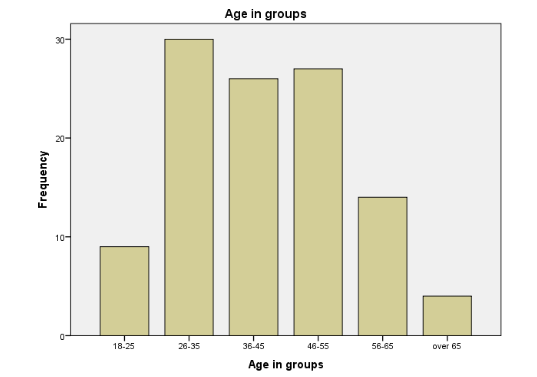
Presented in this section are the findings of the descriptive statistics. Of the 110 valid participants, the majority were females. As shown in Table 2 that 51% (n = 56) of the participants were female and 49% (n = 54) of the valid participants were male. Participants’ age ranged from 18 – over 65. Figure 1 visualizes the distribution of the age groups. Table 3 presents the distribution of the age groups between males and females.
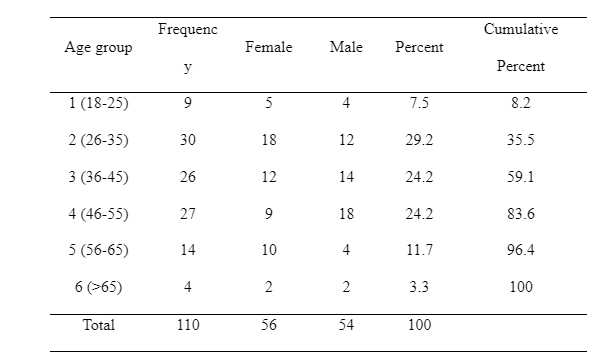
The majority of the participants 30 (27.3%) belonged to the age group 26-35; female: 18, male: 12. The minority of participants 4 (3.6%) belonged to the age group over 65; female: 2, male: 2. However, 27 (24.5%) belonged to the age group 46-55; female: 9, male: 18 and 26 (23.6%) belonged to the age group 36-45; female: 12, male: 14. Then, 14 (12.7%) belonged to the age group 56-65; female: 10, male: 4, and 9 (8.1%) belonged to the age group 18-25; female: 9, male: 5.
The OGS and EWPS. In general, the OGS results indicated low employee game-related Internet behavior for this sample of employees. The scores ranged from a low 0 to a high of 54. The mean score of 15.48 was 11.52 points below the midpoint score of 27.00. Table 4 shows the scores of the OGS and EWPS.
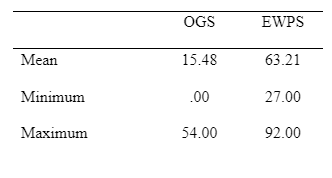

In general, the EWPS results indicated high productivity for this sample of employees. The scores ranged from 27.00 to 92.00. The mean score of 63.21 was 27.01 points above the midpoint score of 30.71. Each mean score was a numeric value computed by summing the items and dividing by the number of items that make up the scale.
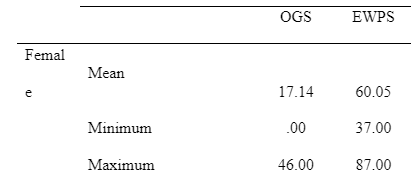
Gender. As shown in Table 5, the OGS results indicated low scores employee game-related Internet behavior for this sample of female employees. The scores ranged from a low 0.00 to a high of 46.00. The mean score of 17.32 was 5.68 points below the midpoint score of 23.00. The EWPS results indicated high productivity for this sample of female employees. The scores ranged from 37.00 to 87.00. The mean score of 60.05 was 32.05 points above the midpoint score of 25.00.
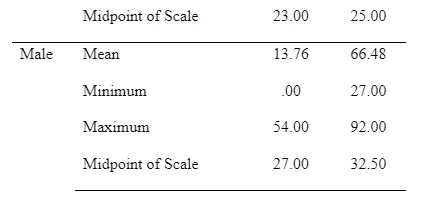
As shown in Table 5, the OGS results indicated low employee game-related Internet behavior scores for this sample of male employees. The scores ranged from a low 0.00 to a high of 54.00. The mean score of 13.76 was 13.24 points below the midpoint score of 27.00. The EWPS results indicated high productivity scores for this sample of male employees. The scores ranged from 27.00 to 92.00. The mean score of 66.48 was 33.98 points above the midpoint score of 32.50.
Age. As Table 5 shows, the OGS results indicated slightly higher scores for female employees on game-related Internet behavior and high scores for male employees on game-related Internet behavior for this sample of the age group 18-25. The scores ranged from low 0.00 to a high of 46.00 for females and low 23.00 to a high of 54.00 for males. The female mean score of 36.00 was 26.00 points above the midpoint score of 10.00. The male mean score of 40.25 was 24.75 points above the midpoint score of 15.50.
The EWPS results indicated higher scores for female employees on work productivity and high scores for male employees on work productivity for this sample of the age group 18-25. The scores ranged from 37.00 to 49.00 for females and 27.00 to 65.00 for males. The female mean score of 44.00 was 38.00 points above the midpoint score of 6.00. The male mean score of 44.25 was 25.25 points above the midpoint score of 19.00.
As Table 6 shows, the OGS results indicated neutral scores for female employees on game-related Internet behavior and neutral scores for male employees on game-related Internet behavior for this sample of the age group 26-35. The scores ranged from low 1.00 to a high of 38.00 for females and low 4.00 to a high of 39.00 for males. The female mean score of 20.11 was 1.61 points above the midpoint score of 18.50. The male mean score of 21.42 was 3.92 points above the midpoint score of 17.50.
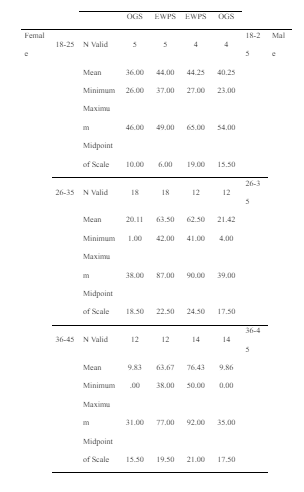
The EWPS results indicated slightly higher scores for female employees on work productivity and high scores for male employees on work productivity for this sample of the age group 26-35. The scores ranged from 42.00 to 87.00 for females and 41.00 to 90.00 for males. The female mean score of 63.50 was 20.50 points above the midpoint score of 22.50. The male mean score of 62.50 was 19.00 points above the midpoint score of 24.50.
As Table 6 shows, The OGS results indicated low scores for female employees on game-related Internet behavior and equally low scores for male employees on game-related Internet behavior for this sample of the age group 36-45. The scores ranged from low 0.00 to a low of 31.00 for females and low 0.00 to a high of 35.00 for males. The female mean score of 9.83 was 5.67 points lower the midpoint score of 15.50. The male mean score of 9.86 was 7.64 points lower the midpoint score of 17.50.
The EWPS results indicated high scores for female employees on work productivity and slightly higher scores for male employees on work productivity for this sample of the age group 36-45. The scores ranged from 38.00 to 77.00 for females and 50.00 to 92.00 for males. The female mean score of 63.67 was 44.17 points above the midpoint score of 19.50. The male mean score of 76.43 was 55.43 points above the midpoint score of 21.00.
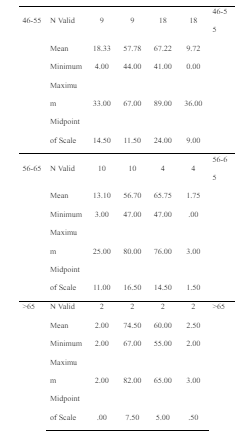
As Table 6 shows, the OGS results indicated neutral scores for female employees on game-related Internet behavior and neutral scores for male employees on game-related Internet behavior for this sample of the age group 46-55. The scores ranged from low 4.00 to a low of 33.00 for females and low 0.00 to a high of 36.00 for males. The female mean score of 18.33 was 3.83 points higher the midpoint score of 14.50. The male mean score of 9.72 was 0.72 points higher the midpoint score of 9.00.
The EWPS results indicated high scores for female employees on work productivity and high scores for male employees on work productivity for this sample of the age group 46-55. The scores ranged from 44.00 to 67.00 for females and 41.00 to 89.00 for males. The female mean score of 57.78 was 46.28 points above the midpoint score of 11.50. The male mean score of 67.22 was 50.72 points above the midpoint score of 16.50.
As shown in Table 6, the OGS results indicated neutral scores for female employees on game-related Internet behavior and neutral scores for male employees on game-related Internet behavior for this sample of the age group 56-65. The scores ranged from low 3.00 to a low of 25.00 for females and low 0.00 to a high of 3.00 for males. The female mean score of 13.10 was 2.10 points higher the midpoint score of 11.00. The male mean score of 1.75 was 0.25 points higher the midpoint score of 1.50.
The EWPS results indicated high scores for female employees on work productivity and high scores for male employees on work productivity for this sample of the age group 56-65. The scores ranged from 47.00 to 80.00 for females and 47.00 to 76.00 for males. The female mean score of 56.70 was 40.20 points above the midpoint score of 16.50. The male mean score of 65.75 was 51.25 points above the midpoint score of 14.50.
As Table 6 shows, the OGS results indicated neutral scores for female employees on game-related Internet behavior and neutral scores for male employees on game-related Internet behavior for this sample of the age group over 65. The scores ranged from low 2.00 to a low of 2.00 for females and low 55.00 to a high of 65.00 for males. The female mean score of 2.00 was 2.00 points higher the midpoint score of 0.00. The male mean score of 2.50 was 2.00 points lower the midpoint score of 0.50.
The EWPS results indicated high scores for female employees on work productivity and high scores for male employees on work productivity for this sample of the age group over 65. The scores ranged from 67.00 to 80.20 for females and 55.00 to 65.00 for males. The female mean score of 74.50 was 67.00 points above the midpoint score of 7.50. The male mean score of 60.00 was 55.00 points above the midpoint score of 5.00. Presented in this section was the preliminary analysis. The next section is the primary analysis, which includes analysis of multiple regression analyses.
Primary Data Analysis
The primary data analysis section includes information that answers the research question by addressing corresponding hypotheses. The hypotheses testing was done concerning how well the three predictor variables can predict one response variable; the regression analysis was used. In this study, the predictor variables were employee game-related Internet behavior, gender, and age. The single response variable was employee work productivity. Prior to testing the proposed hypotheses, the preliminary analysis was conducted to ensure satisfactions of the assumptions in regression. The results presented in the next subsections are the results of multiple correlation and regression analyses to address the research question and hypotheses.
Descriptive Statistics
Presented in this section is the preliminary analysis of descriptive statistics for all four variables in the study. Table 3 presents the descriptive statistics for the research variables of employee game-related Internet behavior (OGS), gender, age, and work productivity (EWPS).
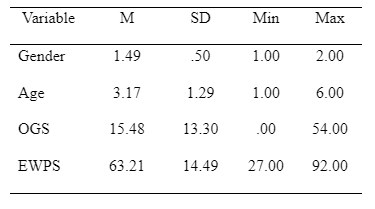
The results in Table 3 present the summary of descriptive statistics for the variables in the study. In coding phase, a dummy predictor variable like gender may have a value of 0, which will cause that variable’s coefficient to have no role in impacting the predictor variable, while when the dummy receives a value of 1 its coefficient acts to alter the intercept. Then, female and male can be the categories of the gender variable (nominal). Thus, the female was arbitrarily assigned the value of 1; the male received then value 2. The mean gender of the participants was 1.49, with 1.49 standard deviation 1.49. The gender of the participants ranged from 1 (Min) to 2 (Max).
The predictor variable age is made ordinal due to how the data was collected in age groups. The mean age of the participants was 3.17 years of age, with a standard deviation 3.11. The age of participant ranged from age groups 1 (Min) to 6 (Max). Age group 1 corresponded participants age of 18 – 25, age group 2 corresponded participants age of 26 – 35, age group 3 corresponded participants age of 36 – 45, age group 4 corresponded participants age of 46 – 55, age group 5 corresponded participants age of 56 – 65, and age group 6 corresponded participants age of 65.
The predictor variable OGS is treated as an interval. The mean OGS of the participants was 15.48, with a standard deviation 13.30. The number of scores the participants received from the OGS questionnaire varied between (Min) 0.00 and (Max) 54.00. The response variable EWPS is treated as an interval. The EWPS mean scores were 63.21 with a standard deviation of 14.49. Whereas, from the EWPS questionnaire scores varied between (Min) 27.00 and (Max) 54.00.
The calculation method of the composite score was that the OGS and EWPS scales scores were composite scores for the items on the scale. Each composite score was a numeric value computed by summing the items that make up the scale. The OGS was a scale (Appendix D) developed and tested for the current study to measure employee game-related Internet behavior in the workplace as self-reported by employees. There were 16 items and each measured on a 5-point scale with 0-never; 1-seldom; 2-sometimes; 3-often; and 4-almost always. However, after the data collection, a correlation matrix for the OGS items was run (Appendix J).
The EWPS was exiting questionnaire (Appendix D) and used to measure employee’s work productivity in the workplace as self-reported by employees. There were 25 items, and each measured on a 5-point reversed scale with 0-almost always; 1-often; 2-sometimes; 3-seldom; and 4-never because a higher value of EWPS equated to more productive. Whereas, on the original EWPS scale with 0-never; 1-seldom; 2-sometimes; 3-often; and 4-almost always, the lower the score, the higher the productivity because the items are asking about behaviors that are typically associated with less work productivity.
Multiple Regression Statistics
Conducting multiple regression analyses was useful to determine the predictive validity of, and the association between, the predictor variables and the response variable. Specifically, in the current study, multiple regression analyses were necessary to test if the employee game-related Internet behavior, gender, and age significantly could predict employee work productivity. In the preceding correlation analyses, the correlation coefficients provided a measure of the reliability of the linear relationship between the above variables. The p-value was used to determine whether to reject or accept the null hypothesis. A p-value of .01 indicates a 99% confidence level. A p-value of .05 indicates a 95% confidence level. A p-value of .13 indicates an 87% confidence level.
In these multiple regression analyses, the regression coefficients provided information on the strength of such linear relationship. Creswell (2002) indicated correlations that range from .20 to .35 have only a slight relationship, correlations above .35 are useful for limited prediction, correlations that range from .66 to .85 are good for prediction, and correlations of .86 and above typically occur for studies of construct validity or test-retest reliability (Weir, 2005).
Correlation
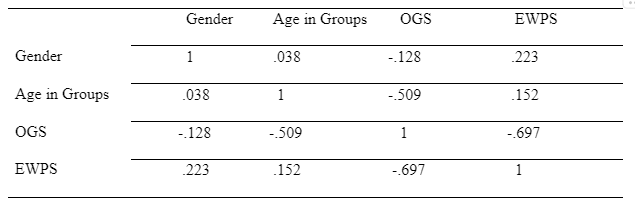
In the above correlation table, EWPS is the dependent variable, whereas gender, age and OGS are independent variables. The correlation value between EWPS and gender comes to be 0.223 showing a positive relationship between the two variables. Similarly, the correlation between EWPS and age comes to be 0.015 meaning that both the variables are positively related. Finally, EWPS and OGS negatively related as the correlation coefficient between them comes out to be -0.697. However, as the EWPS scale is reversed, because the items in the scale are written to identify behaviors that are not productive, thus it suggests that there is a strong positive relationship between OGS and EWPS at the significant level of <.001. Moreover, the association between OGS and age and OGS and gender is negative.
Test for Collinearity Issue
This is done to find if there is any issue in collinearity analysis in the given data.


By viewing above table, the value of VIF for all the variables is less than 10, and Tolerance for all the variable is more than 0.2. This demonstrates that there is no collinearity issue in the data.
Regression

Here, a model summary table is determined which provides the value of R, R2 and adjacent R2, which is used to determine how well a regression model fits the data, where R represents multiple correlation coefficients for dependent variables. In this analysis, EWPS is a dependent variable whose value is 0.747 which indicates a good level of prediction. The coefficient of determination, R2 which is determined by independent variables whose value is coming out to be 0.558 is relatively high value and indicates the proportion of the variance in the response variable, showing EWPS is more predictable from the predictor variables gender, age and OGS among sample participants. This shows that independent variables explain 55.8% of the variability of the dependent variable.
Coefficient
Statistical Significance
To test whether overall regression model is fit to the data, an ANOVA table with F-ratio is drawn.


The table demonstrates that the independent variables statistically significantly predict the dependent variable, F (3, 106) = 44.522, p 0.05 thus proving regression model is a good fit of the data.

Estimate Model Coefficient
To find regression for given model, the coefficient model is developed:
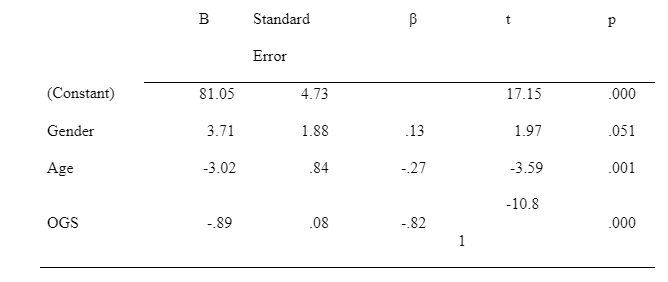
Unstandardised coefficients indicate how much the dependent variable varies with an independent variable. The unstandardised coefficient for gender is 3.708, which shows that with an increase in gender, there is an increase in EWPS, whereas the unstandardised coefficient for age and OGS are -3.020 and -.891 respectively. This shows that with an increase in age and OGS, there is a decrease in EWPS. Moreover, t-value of gender is positive wherever, t-values of age and OGS are negative. Further, if the value of p< 0.05, it concludes that the coefficients have statistically significant impact on the dependent variable. So, the p-value is shown in the table in the form of Sig. shows that p-value of gender is >0.05 and p-value of age and OGS < 0.05, thus displaying that independent variables like OGS and age have statistically significant impact on EWPS, whereas independent variable gender has no statistically significant impact on EWPS.
A multiple regression analysis was performed from gender, age and OGS, which are the independent variable, and EWPS which is the dependent variable. These variables statistically significantly predicted F (3, 106) = 44.522, p 0.05, R2 = 0.558. Two independent variables age and OGS added statistically significantly to the prediction, p < .05.
Continue your journey with our comprehensive guide to Practical Statistical Analysis.
- 24/7 Customer Support
- 100% Customer Satisfaction
- No Privacy Violation
- Quick Services
- Subject Experts


