VR Diagnostic System for Cervical Myelopathy
Hypothesis
Leap Motion Controller is a reliable and valid device in the 15-second hand grip and release test. Additionally, we hypothesised that the total number of hand flexion-extension cycles and the degree of motion decrease as the person fatigue. For those seeking support in this area, biomedical science dissertation help can provide valuable insights and assistance in exploring such hypotheses.
Rationale
This proof of concept study is aimed to be the first step in providing an objective dynamic assessment tool to quantify the degree of cervical myelopathy as well as the degree of deterioration and improvement before and after cervical compression surgery, respectively.
Moreover, to establish a benchmark for each person that allow monitoring the neurological health of people, whether comparing that to the normal baseline range or monitor their status as they progress in the treatment. Furthermore, it will facilitate multi-centre investigations and comparisons.
Objectives
Primary Objectives:
To assess test-retest reliability (other forms of reliability?) of the Leap Motion Controller and examine its criterion concurrent validity, against an external digital camera, in the 15-second hand grip and release test.

Validity & Reproducibility
Quantify the frequency of the dynamic motion of the hand at a defined time combining 2D video-based camera with 3D virtual reality
Characterize the relative contribution of specific anatomical regions of the hand to the overall motion, thus adjust for confounding motions
Determine its suitability as a hand frequency tracking sensor
Secondary Objectives:
To set a baseline measurement of the total number of hand flexion-extension cycles and analyse the degree of motion in healthy individuals.
Baseline measurement
Provide an overall baseline frequency score for the hand grip and release test using leap motion controller in healthy individuals in increments of 10 seconds
Visualize the magnitude of grip and releases movements
Assess the variations in speed of hand movements
Assess gender variations
Assess the impact of dominant hand on the score
Dig deeper into Practical Application of Two-Factor ANOVA with our selection of articles.
The study design is a proof of concept clinical trial aiming to incorporate VR with the 15-second grip and release test. In addition to establishing a benchmark scales for healthy individual, the hypothesis states that;
“Leap Motion Controller (LMC) is a reliable and valid device in the 15-second hand grip and release test and the total number of hand flexion-extension cycles and the degree of motion decrease as the person fatigue.”
III.i. Study Proposal:
A study protocol was submitted to the Faculty of Medicine and Health Sciences at Queen’s Medical Centre (QMC), Nottingham in February 2015. Ethical approval was obtained by The University of Nottingham Ethics committee on 20th May 2015 (Appendix-1).
Upon joining the study in October 2015 as a key researcher, two amendments forms were submitted to the Ethics committee. Consequently, granting approval for different modalities of recruitment, changes in the protocol and poster, the addition of an external camera to capture participants’ hand and the extension of validity and reliability assessment of LMC (Appendix-2). Recruitment and data collection began as soon as amendments were approved.
III.ii. Sample Selection:
Recruitment was limited to students from any background complying with the inclusion criteria (see below) and took various forms via short announcements and leaflets/poster (Appendix-3) left for students to pick up if they are interested. Permission from lecturers was sought in advance.
Posters and leaflets were distributed around the Medical School, four libraries and most of The University of Nottingham campuses. Three short announcements were held at City Hospital’s Campus on three different lectures/seminars; students interested in the study were asked to write down their emails.
A formal email (Appendix-4) attached with the participant information sheet (Appendix-5), inclusion/exclusion criteria and a map (Appendix-6) was sent to participants, who were asked to confirm their eligibility by replying back to the email. Eligible participants were then allocated a specified time and provided with directions to the testing room in QMC. Each participant was provided with £ 20 inconvenience allowance for giving up their time.
III.iii. Sample Size Calculation:
The sample size for an adequate power was set to be 50 participants. To determine the required sample, the principle aim had to be identified, which was agreed to be criterion concurrent validity. Although Intra-Class Coefficient is a commonly used test for validity studies (Müller and Büttner, 1994), the use of correlation is misleading (Bland and Altman, 1986). Limits of agreement method, also known as Bland-Altman plot, forms a simpler method to conduct, analyse and interpret (Altman and Bland, 1983).
The sample size consideration was based on the desired precision of the estimates in the Bland-Altman method, which measures the limits of agreement. The decision to recruit 50 participants into the study was based on Doug Altman’s recommendation, where a minimum of 50 is specified (Altman, 1991).
III.iv. Inclusion and Exclusion Criteria
The following eligibility criteria was formulated by M.Rashid under the supervision of his esteemed supervisor.
Inclusion Criteria
Healthy students
Males and Females
Age 18-35 years
Able to give informed consent
Exclusion Criteria
Individuals suffering from locomotor or neurological disorders such as rheumatoid arthritis (RA), cerebral palsy (CP), cervical or thoracic myelopathy, motor neuron disease, degenerative disease (osteoarthritis) or neuromuscular disease
Individuals with congenital or syndromic hand or spine deformities
Individuals sustained displaced hand or cervical fractures
Individuals with previous history of cervical spine or hand surgery
Individuals with sensory or motor symptoms in the spine or hand region (numbness, clumsiness, motor weakness)
Individuals with special communication needs
III.v. Apparatus
A laptop computer (MSI GT72 Dominator Pro Dragon Edition, Msi-NL., Eindhoven, China) was used to display a visual VR programme (VR-MED), developed by Induce UG, 20251 Hamburg, Germany (manufacturer of the VR Goggles) displaying the position of fingers at each 0.02 second. show and count the frequency of the grip and release motion. A Leap Motion Controller (Version 3.3.1 Orion, Leap Motion Inc., San Francisco, CA, US) was connected to the laptop and firmly attached to a table (cm X cm in area and cm in height), securing no undesired movement of the controller.
The LMC device was placed 2.95 inches in front of the keyboard, centered to the screen, and 3.93 inches from the edge of the table, for the whole duration of the experiment. In front of the computer, a chair was arranged 20 inches from the edge of the table at an appropriate height from the table (Image-14). The dominant arm of the participant was placed in a pronated position with the elbow flexed to 90°.
The positions of all adaptable components of the apparatus remained steady for the whole duration of the experiment. A bright light was ensured in the room during the experiment and the temperature was set constant at 22-24 degrees Celsius during all measurements (Guna et al. 2014).

The coordinate system and location of the device were set according to the leap motion user guidelines (Motion, 2016), where the Z axis pointed towards the participant, the X axis to his/her right side and the Y axis facing upwards (Figure-15).

The location of the hand was placed 10 centimeters on the side of the controller, rather than above it, as it was validated to have a better accuracy in a previous study, especially for the hand grip motion (Katahira et al. 2015) and 20 cm above the controller (Motion, 2016). The wrist splint was weared and BECCA handThe wrist was held stationary to the armed chair by a band () at the wrist level to prevent the trick motion of the wrist (Honso et al. 2009).
III.vi. Software:
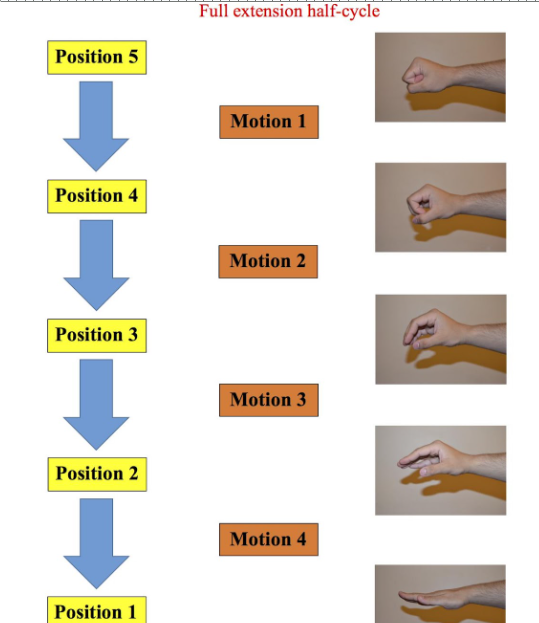
The LMC software, VR-MED, was developed by Induce UG, 20251 Hamburg, Germany (manufacturer of the VR Goggles) displaying the position of hand and fingers at each 0.02 second. Therefore, the software analyse the motion of hand rather the number of cycles; it captures five positions, each one correlates to 20 degrees of motion:


The duration of a test can be chosen before starting the test (15 seconds, 30 seconds, 45 seconds or chosen time), and the test showed a schematic hand during the test (Image-16). Once a test is undertaken, an Excel spreadsheet is formed with the position of the used hand (Right or Left) at each 0.01 second. Appendix-12 shows one analysis page of Excel for a duration of 0.20 seconds only.

A full flexion half-cycle is the motion from position 1 to position 5 (Image-17), while the motion from position 5 to position 1 is a full extension half-cycle (Image-18). The existence of five positions implies four motions for each full half-cycle, as explained in the diagram below. Therefore, a full cycle includes 8 motions and a full half cycle includes 4 motions.

III.vii. Data Collection
Data collection took place on three days between 9-18:00 at Seminar Room C1389 in Academic Orthopaedic, Trauma and Sports Medicine at QMC. Approximately three eligible participants reported together at their allocated time slot (Appendix-7). M.Rashid was the principle and only investigator during data collection.
III.Vii.i. Focus group discussion, Coding and Demographic data:
A small focus group discussion was held before the study began; the aim and process of the study were elucidated in-depth, and participants were given an information sheet to read again with the possibility to ask questions. The investigator explained the inclusion/exclusion criteria and participants were asked to confirm their eligibility.
If a volunteer agreed to take part in the study, they were allocated a special code (Appnedix-8) to blind the data from the investigator, who conducted the analysis, and keep the confidentiality of participants. A consent form (Appendix-9) had to be signed and dated by both the student and the investigator followed by a biographic information sheet (Appendix-10) to be completed by the participant and signed by the investigator, which included the following information:
Participant’s special coding number
Occupation
Date of Birth
Gender
Dominant hand
Forearm measurement
Hand circumference
Wrist splint size
III.Vii.ii. Wrist splints:
Wrist splints were used to prevent paradoxical wrist trick motion (Ono, 1998; Hosono et al., 2010), described above, specifically excessive wrist extension during the grip (finger flexion) phase, limiting the motion to the hand. Because metals hamper the performance of Virtual Reality application (Craig, Sherman and Will, 2009), PROMEDICS® non-metal splints were chosen (Image-19).

The current modalities for sizing a wrist splint are custom-made splint by occupational therapists, sizing guidelines of splint companies or by fitting them in. Hence, determining splint size for each participant followed Storm Wrist Brace Sizing Guide (Appendix-11), which is based on forearm and hand circumference measurements; hand circumference is measured at the widest part of the palm by a centimetre tape and the forearm circumference is measured at a distance of 4 centimetres of the wrist’s crease (Image-20).


III.vii.iii. Assessing the outcomes:
Before starting the intervention, the individuals were instructed about the intervention and a short tutorial was given about acquiring a full cycle. In order to assess the outcomes of the study, participants were instructed, with their splinted dominant hand pronated, to fully grip and release their fingers as rapid as possible “grip and release test”, for three times with a 10-minute rest between tests:
First test – Validity ‘Concurrent’ trial: 15-second test; VR vs External camera
Second test – Reliability ‘intrarater’ trial: 1st 15-second test vs 2nd 15-second test
Third test – Benchmark trial: 3-minute test OR till exhaustion

III.vii.iv. Analyses:
The VR device measured hand’s position in each trial while the external camera was only used on the first 15-second test to establish criterion validity. A cycle was defined as any forward-backward motion between positions regardless of the number of motions, e.g. 1🡪2🡪1 while a half cycle is composed of motion within one direction, e.g. 1🡪2🡪3🡪4.
Virtual-Reality Data:
VR-Med software formed an excel spreadsheet for each undertaken test (Appendix-), which was saved using the student’s special code, and showed the position of hand in succession of 0.02 second. Therefore, the total number and motion analysis of cycles for the three tests was counted manually in increments of half cycles. Additionally, in benchmark trial, the quality of motion was analysed for each cycle and the mean in 10-second intervals was calculated in which a full cycle includes 8 motions and full half-cycle is composed of 4 motions. The VR data analyses were onerous tasks and took 350 hours per se. An example of an analysis of 0.27 second, one cycle, is shown below (Image-22)

External Camera Data:
The recording began from the last count down of the VR-Med application to capture the “actual” cycles measured by VR and the forearm and hand only were included in the field of view to reduce observer bias when assessing the recordings blindly at a later time (Hosono et al. 2010).
The digital camera captured the first 15-second test of the fifty participants. Participants’ codes were used to save the files. Videos were slowed down to 0.25x analysed by three examiners (x, X, x) using VLC media player, Version 2.2.1 Terry Pratchett (Weatherwax).
III.viii. Statistical Analyses
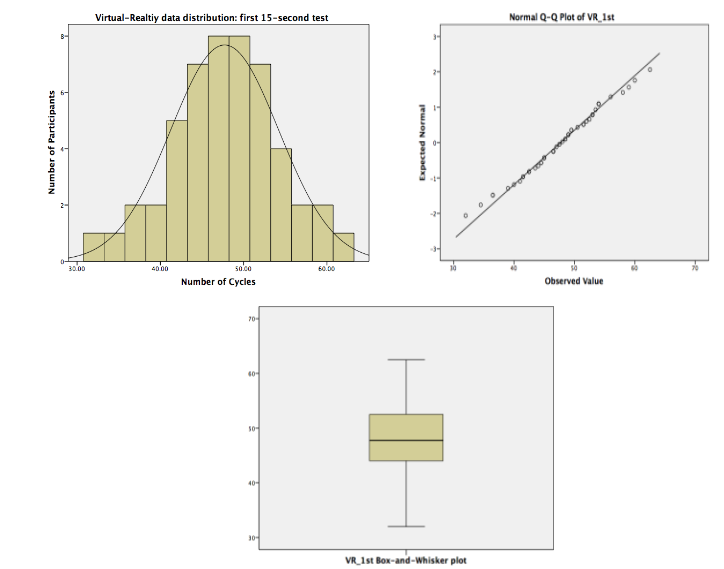
SPSS Version 22.0 and Microsoft® Excel Version 15.14 were used to analyse all data. Demographic data was examined by descriptive and frequency analysis. A Shapiro-Wilk test (Shapiro & Wilk, 1965), skewness and kurtosis Z-values and a visual inspection of histograms were used to determine the normality of all continuous samples. Normal probability plots (Q-Q plots) and box-and-whisker plots were also generated in SPSS and analysed accordingly. Parametric tests were used for Normally distributed data while non-Normally distributed data were treated as non-parametric.
III.viii.i. Validity testing:
The only relevant validity test in our study is criterion (concurrent) validity, which check the correlation between a test and a criterion variable, a previous established test (citation DUNDEE).
To establish criterion validity, a concurrent validity evidence was applied, which means that the Leap Motion Controller data and the criterion, visual analog via an external camera, data were collected at the same time. Strictly speaking, our study was concurrently validated against Hosono et al, (2010, 2012), which has already been shown to be valid and reliable.
As per Hosono’s study in 2008, the fifty files from the external digital camera were analysed independently and blindly by three different assessors, who underwent a practical session before the analysis. The measurements were counted in an accretion of half cycles (0.5) from a fully extended hand to fully flexed and vice-versa. The mean of each single numbered file was calculated before comparing them against the leap motion controller outcomes.
The interrater reliability of the three fixed examiners was analysed by a two-way mixed Intraclass Correlation Coefficient (ICC) using absolute agreement and an alpha model, investigating random error effects from both assessors or subjects (Shrout, Fleiss, 1979). Unlike Pearson’s correlation coefficient, ICC accounts for consistency of performances and measures the relationship between more than two groups of values (Lexell and Downham, 2005), i.e. three examiners.
A bivariate two-tailed Pearson’s correlation coefficient, for normally distributed data, was computed to assess the relationship between VR_1st and the external camera (human inspection) and was analysed and scatter-plotted using SPSS. It is noteworthy that the interrater reliability of counting the frequency of the grip and release cycles by three assessors was shown previously be significantly high, Intraclass Correlation Coefficient= 0.989, (Hosono et al. 2010).
Although Intra-Class Coefficient is a commonly used test for validity studies (Müller and Büttner, 1994), the use of correlation is misleading and measures the strength of a relationship between two variables rather than the agreement between them (Bland and Altman, 1986). Limits of agreement method, also known as Bland-Altman plot, forms a simpler method to conduct, analyse and interpret (Altman and Bland, 1983) and was also incorporated in our analysis.
Future work: a predictive validity test to be assessed later.
III.viii.ii. Reliability testing:
Intrarater reliability / Test-retest reliability
Intra-rater reliability is defined as ability of one assessor to retest the same outcomes under the same intervention conditions (Iversen, and Norpoth, 1976). It was reported by Coefficient of Repeatability (CR) with 95% confidence interval (IC), calculated as 2* SD of differences between the two measurements, 1st 15-second test – 2nd 15-second test (Bland and Altman, 1986).
CR, a useful index that quantifies absolute reliability and justify random and systematic error, was shown to be an improvement over Pearson’s correlation coefficient and ICC, which are measures of relative reliability and do not account for inherent systematic errors (Vaz et al., 2013). However, measurement literature implies the use of both relative and absolute reliability measurement error indices as best practice guidelines (Atkinson and Nevill, 1998; Bland and Altman, 2003). Thus, a bivariate two-tailed Pearson’s correlation coefficient of relative reliability was calculated to assess relative reliability.
The CR is precisely associated with the 95% limits of agreement devised by Bland and Altman (1986). Therefore, Bland-Altman approach was used by plotting the mean of the two time points for each participant on the X axis and the difference between the two measurements on the Y axis.
The smaller the CR the more homogenous the data and thus more reliable (Vaz et al., 2013).
Interrater reliability
Because all the measurements are recorded by the Leap Motion Controller and assessors were not part of the procedure, interobserver reliability was not required.
III.viii.iii. Setting the benchmark for healthy individuals:
The test was divided into 10-second intervals and data were analysed accordingly. Mean and Confidence Intervals (SD) of normally distributed cycles and motions were calculated and plotted individually as well as combined using Excel. Median and Inter Quartile Range (IQR) of participants were used for fatigue point. The number of participant available at each time point was measured and plotted in Excel using survival analysis line chart. Gender and dominant-hand differences were analysed using independent-samples t-test for Normally distributed unpaired data and Mann-Whitney U test for non-parametric unpaired data.
IV.i. Demographics:
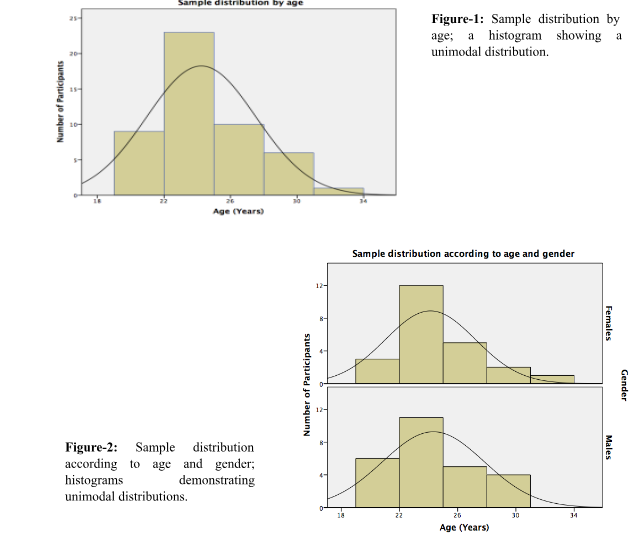
Of the 50 volunteers, 27 were males (54%), and 23 were females (46%). Participants’ age had a unimodal distribution ranging between 19-34 years (Mean = 24.24, SD = 3.28) and with a peak in the 22-25 age group (Figure-1). Distribution of age was analysed according to gender and was found to have a normal bell-shaped curve with a peak at the 22-25 age group in males and females (Figure-2). Range of age was 19-31 years in males (Mean = 24.3, SD = 3.48) AND 19-34 years in females (Mean= 24.1, SD = 3.09). 46 of the participants were right-handed (92%), and 4 left-handed (8%). A significant positive correlation was shown between right and left-handed individuals in regards to the total number of cycles (Pearson’s r = 0.934) while no statistical significance was found for the magnitude of motion (Pearson’s r = 0.007). It is noteworthy that 3 of the 4 left-handed participants were males and one fatigued 62 seconds before others.
IV.ii. Validity:
IV.ii.i. Data Characteristics:
A Shapiro-Wilk’s test (P > 0.05) (Shapiro & Wilk, 1965; Razali & Wah, 2011), a visual inspection of their histograms, normal probability plots (Q-Q plots) and symmetrical box-and-whisker plots showed that the cycles scores were approximately normally distributed for the first 15-second Virtual-Reality (VR_1st) (Figure-3) and the digital camera’s video data (Video) (Figure-4), with a skewness of -0.36 (SE=0.337) and a kurtosis of 1.28 (SE=0.662) for VR_1st data and skewness of -0.195 (SE=0.337) and a kurtosis of -0.033 (SE=0.662) for Video data (Cramer, 1998; Cramer & Howitt, 2004; Doane & Seward, 2011).

IV.ii.ii. Inter-rater reliability of videos’ data:
Two-way mixed Intraclass Correlation Coefficient (ICC) using absolute agreement between the three examiners was high, ICC=0.998 (95%CI= 0.997-0.999) and a P-value of zero. ICC was computed assuming the interaction effect is absent, because it is not estimable otherwise.
IV.ii.iii. Validity measurement:
The bivariate Pearson correlation coefficient showed statistically significant linear relationship between the VR_1st and Video data, [r = 0.995, n=50, p= 0.00 (2-sided)]. A scatterplot summarises the results (Figure-5). Overall, there was a strong, positive constant correlation between the Leap Motion Controller and human inspection.

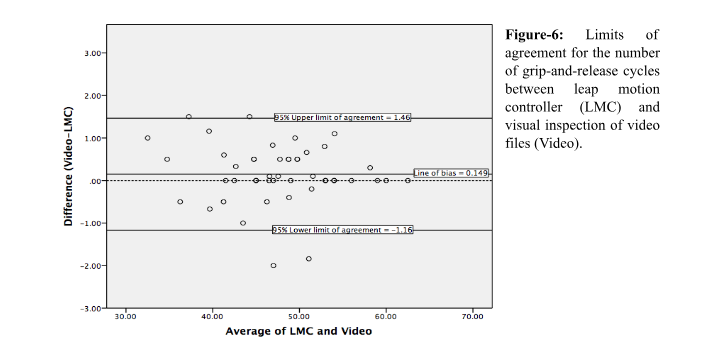
However, it can not be concluded that the two methods agree as a result of the strong correlation shown above. Pearson’s r evaluates the strength of correlation rather than the agreement between two variables (Bland and Altman, 1986). Therefore, limits of agreement method, also known as Bland-Altman plot, was schemed to compare the number of grip-and-release cycles measured by a leap motion controller and human inspection via recorded videos (Figure-6).
The measurements of mean and difference between the two variables (Video-LMC) do not have to follow a normal distribution, thus distribution of the mean was not analysed. However, to report the precision of estimated limits of agreement, standard error and confidence interval, the distribution of the difference had to be normally distributed (Bland and Altman, 1986), which was asserted using a histogram and box-and-whisker plot.
The mean difference, observed bias, was 0.1494 cycles (95% CI= 0.0967 to 0.2020) with a minimum difference of -2.0 and maximum value of 1.50. Therefore, LMC tends to underestimate the number of grip-and-release cycles, by between 0.0967 and 0.2020, and 95 % upper and lower limits of agreement were -1.16 and 1.46, respectively. These limits tell us that for approximately 95% of cases, the LMC measurement of the number of grip-and-release cycles will be between -1.16 and 1.46 times the visual inspection.
Additionally, the shape of the graph is even around the negligible line of bias and does not differ in any systematic way over the range of measurement, indicating its consistency; the chance of over-/under-estimation is equal regardless of the number of cycles people could do. Despite this, the limits of agreement (-1.16 and 1.46) were small enough for us to be confident that the new method can be used in place of the old for clinical purposes.
IV.iii. Reliability:
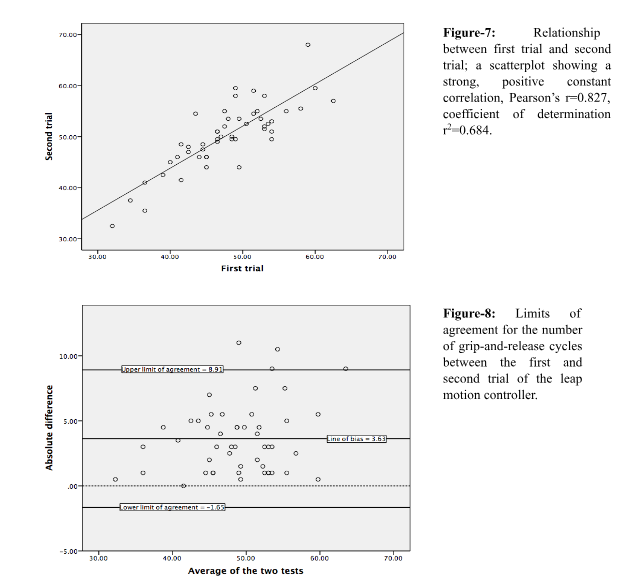
The bivariate Pearson’s correlation coefficient of relative reliability showed a statistically significant linear relationship between the two tests [r = 0.827, n=50, p= 0.00 (2-sided)]. A scatterplot summarises the results (Figure-7). Overall, there was a strong, positive constant correlation between the two tests. Neither the presence nor absence of the outlier in Figure-7 would significantly affect the correlation line, r2=0.684, r2=0.671, respectively.
The reliability coefficient (CR) or the Smallest Real Difference (SRD), assuming the least detectable difference, of the total number of grip-and-release cycles for the leap motion controller was ± 5.393. The mean difference for the number of grip-and-release cycles between the two tests measured by leap motion controller was computed using Bland-Altman plot (Figure-8). The measurements of mean and difference between the two test do not have to follow a normal distribution. However, to report the precision of estimated limits of agreement, standard error and confidence interval, the distribution of the absolute difference had to be normally distributed (Bland and Altman, 1986), which was asserted using a histogram and box-and-whisker plot.
The mean difference, observed bias, was 3.63 cycles (95% CI= 3.418 to 3.841), and was within the cycles’ index of measurement error (±5.393), with a minimum difference of 0.0 and maximum value of 11.0. Lower and upper limits of agreement that contain 95% of differences between repeated measurement on same subjects were -1.65 and 8.91, respectively.
Additionally, the shape of the graph is even around the negligible line of bias and does not differ in any systematic way over the range of measurement, indicating its consistency; the chance of variation around the measurement per se, whether increased or decreased, is equal regardless of the number of cycles people could do.
IV.iv. Benchmark:
Data characteristics of the number of grip-and-release cycles and magnitude of motion for each time interval were normally distributed, examined by skewness and kurtosis Z values, histograms, Q-Q plot and box-and-whisker plots.
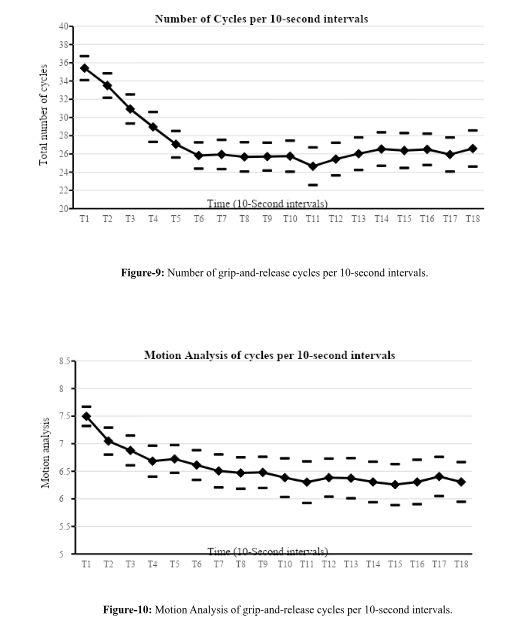
The number of grip-and-release cycles in the third test, benchmark trial for three minutes or till exhaustion, was counted in intervals of 10 seconds and plotted using line-graph with confidence intervals in Excel (Figure-9). The first time interval (T1) accounted for the first 10 seconds (0 to 10 seconds). As shown in the figure below, there was a sharp decline in the number of cycles between 0 and 60 seconds. It tended then to level off for 40 seconds and bottomed at T11 with the widest CI. There was a slight, statistically insignificant, increase in the number of cycles afterwards.

Similarly, the quality of motion was analysed in 10-second intervals in which a full cycle included 8 motions and full half-cycle is composed of 4 motions (Figure-10). There was approximately a constant decrease in the magnitude of grip-and-release motion, ranging from a maximum average of 7.49 at T1 to a minimum average of 6.25 at T15.
Additionally, the number of cycles and their motion magnitudes in 10-second intervals were plotted together using a combined bar and line graph (Figure-11). In nutshell, the motion declines in a more rapid and consistent manner than the number of cycles.

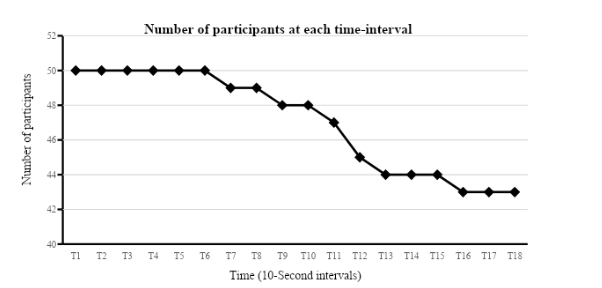
The number of participants available at each time period was computed and plotted using a survival analysis line chat (Figure-12), which showed that a total of 43 participants were able to grip-and-release their hand for three minutes and only seven volunteers fatigued before 180 seconds, with the earliest fatigue point at T6 interval, precisely 59.38 seconds
IV.iv.i Gender differences:
In total, there were 27 males and 23 females. The number of cycles, motion magnitude and the number of participants available at each time point were computed and plotted according to gender. There was no noteworthy gender difference in the Normally-distributed number of grip-and-release cycles for the first 40 seconds (Figure-13). However, males were found to have a higher decline in the number of cycles afterwards. This gender differences at all time points were not statistically significant, analysed by independent-samples t test; Levene’s test indicated equal variance and P>0.05 at all time intervals (see Appendix-1 to save words count).

On the contrary, motion magnitude data did not have a Normal distribution and a non-parametric Mann-Whitney U test was used to analyse the significance of gender mean differences. In general, females had a larger decline in the magnitude of grip-and-release motion in most of the time intervals although they had a higher magnitude at two points, T15 and T17 (Figure-14). Nonetheless, these differences were not statistically significant at all time points; Mann-Whitney U test, P>0.05.
A total of 3 females (13.04%) fatigued before the end of the test, set at three minutes, with the earliest time point at T6 corresponding to 4 males (14.81%) with the earliest fatigue point at T8. (Figure- 15) shows the number of males and females available at each time interval.

IV.ivi.i Dominant hand differences:
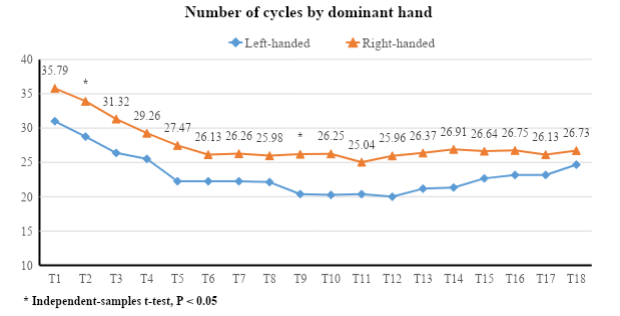
Overall, there were 46 right-handed volunteers (92%) and 4 left-handed (8%). The number of cycles, motion magnitude and the number of participants available at each time point were computed and plotted according to dominant hand.
The number of grip-and-release cycles at each time interval had a Normal distribution with Levene’s test showing equal variance. In general, right-handed individuals achieved constantly higher number of cycles (Figure-16). Strictly speaking, there were no statistically significant differences between the two groups (P 0.05) analysed by a parametric independent-samples t-test at all time point (Table-1), except T2 (P=0.038) and T9 (P=0.038).
The magnitude of cycles’ motion at each time interval had a non-Normal distribution, hence a non-parametric Mann-Whitney U test was used to analyse the significance of mean differences between right-handed and left-handed volunteers. On the whole, right-handed individuals had a constantly smaller magnitude of motion at all time point (Figure-17). However, these differences were statistically significant at T10, T11, T13, T14 and T16 only (Table-2).

Looking for further insights on Understanding the Challenges of Smoking Cessation? Click here.
- 24/7 Customer Support
- 100% Customer Satisfaction
- No Privacy Violation
- Quick Services
- Subject Experts


